Linear Regression
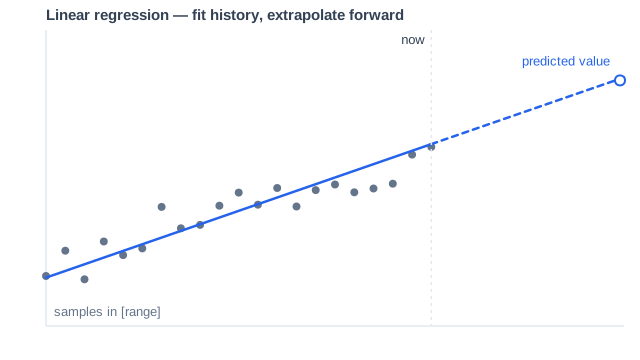
Linear regression predicts the value of a dependent variable from the value of an independent variable. It models the relationship between the variables as a linear equation, and fits a line that minimizes the differences between the predicted and actual values.
How it works
The function fits a least-squares line through each series' samples in the range window, then extends that line the requested number of seconds past the evaluation time. The extrapolated point is the predicted value — which makes it the classic early-warning alert: fire when a value will cross a threshold, not when it already has.
In Dashboards
To use linear regression in a dashboard, apply the following function:
predict_linear( \
  ${promql} \ (1)
  ${prediction_in_seconds} \(2)
)| 1 | ${promql}: PromQL query to evaluate |
| 2 | ${prediction_in_seconds}: Predicts the value of a time series the specified number of seconds in the future. |
For the operator reference — syntax, parameters, and a validated example — see predict_linear in the PromQL documentation.
Limitations
-
Use only with Gauge metric types.
-
Makes assumptions regarding the linearity of the data. Exhibits problems with outliers as it attempts to "overfit" the data, making the detection inconsistent.
-
Do not use with anomaly detection functions that manipulate the underlying data, as it makes anomaly detection unreliable.
-
Each series needs at least two samples in the range window to fit a line; sparse series drop out of the result.
Next steps
For an in-depth discussion of linear-regression, see these external resources:
-
predict_linear() from the Prometheus documentation
-
Linear Regression in Wikipedia