Metric Shaping Rules
Metric shaping rules collapse a high-cardinality metric down to the dimensions you actually need, and store the result as a new recorded metric. For example, http_requests_total arriving with one series per (pod_name, container_id, status, method) combination — tens of thousands of serieses in a large cluster — can be shaped into a few hundred serieses keyed only on (status, method). Dashboards and alerts that read the shaped metric run faster and cost less.
A typical shaping rule takes thousands of per-pod or per-container serieses and folds them into a few hundred serieses keyed only on the dimensions that matter for the question you actually ask — service, status, region, etc.
When to use metric shaping rules
Use a shaping rule when:
-
A metric has so many serieses (per-pod, per-container, per-instance) that querying it on dashboards or alerts is slow or expensive, and you only ever query it grouped by a handful of high-level labels.
-
The high-cardinality labels (e.g.,
pod_name,container_id) were added by the instrumentation library or the collector/agent — sources you have no control over — and they carry no useful information for the dashboards or alerts you actually run. -
You’re approving a tradeoff: you give up the ability to slice by the dropped labels in exchange for cheaper queries on what’s left.
Don’t use a shaping rule if you might want to break down by one of the labels you’re dropping. Once the shaping rule is active, the dropped dimensions are no longer queryable on the shaped metric.
Metric shaping vs. derived metrics
Both features produce a new precomputed metric, but they solve different problems.
| Aspect | Metric shaping rules | Derived metrics |
|---|---|---|
Goal |
Reduce a metric’s cardinality by aggregating it before storage, dropping the original serieses. |
Cache an arbitrary PromQL expression so dashboards and alerts read it cheaply. |
Source |
A single source metric, aggregated by a fixed set of labels. |
Any PromQL — including rate, histogram_quantile, multi-query formulas. |
Original series preserved? |
No. The source metric is replaced by the aggregated output. Pre-shaping serieses stop landing in the queryable metrics store from the moment the rule activates. |
Always. Derived metrics are additive — your source metric is untouched. |
Histogram support |
Yes. When you use the Keep (by) clause on a classic histogram, |
Yes, via |
Where to find it |
menu:Admin[Settings > Shaping rules] |
menu:Metrics[Derived metrics] |
If you want to precompute an arbitrary PromQL expression without changing your source data, use a derived metric instead. If you want to permanently shrink a high-cardinality metric, you’re in the right place — keep reading.
Access metric shaping rules
-
From the left navigation, click Admin.
-
Select Settings > Shaping rules from the menu.
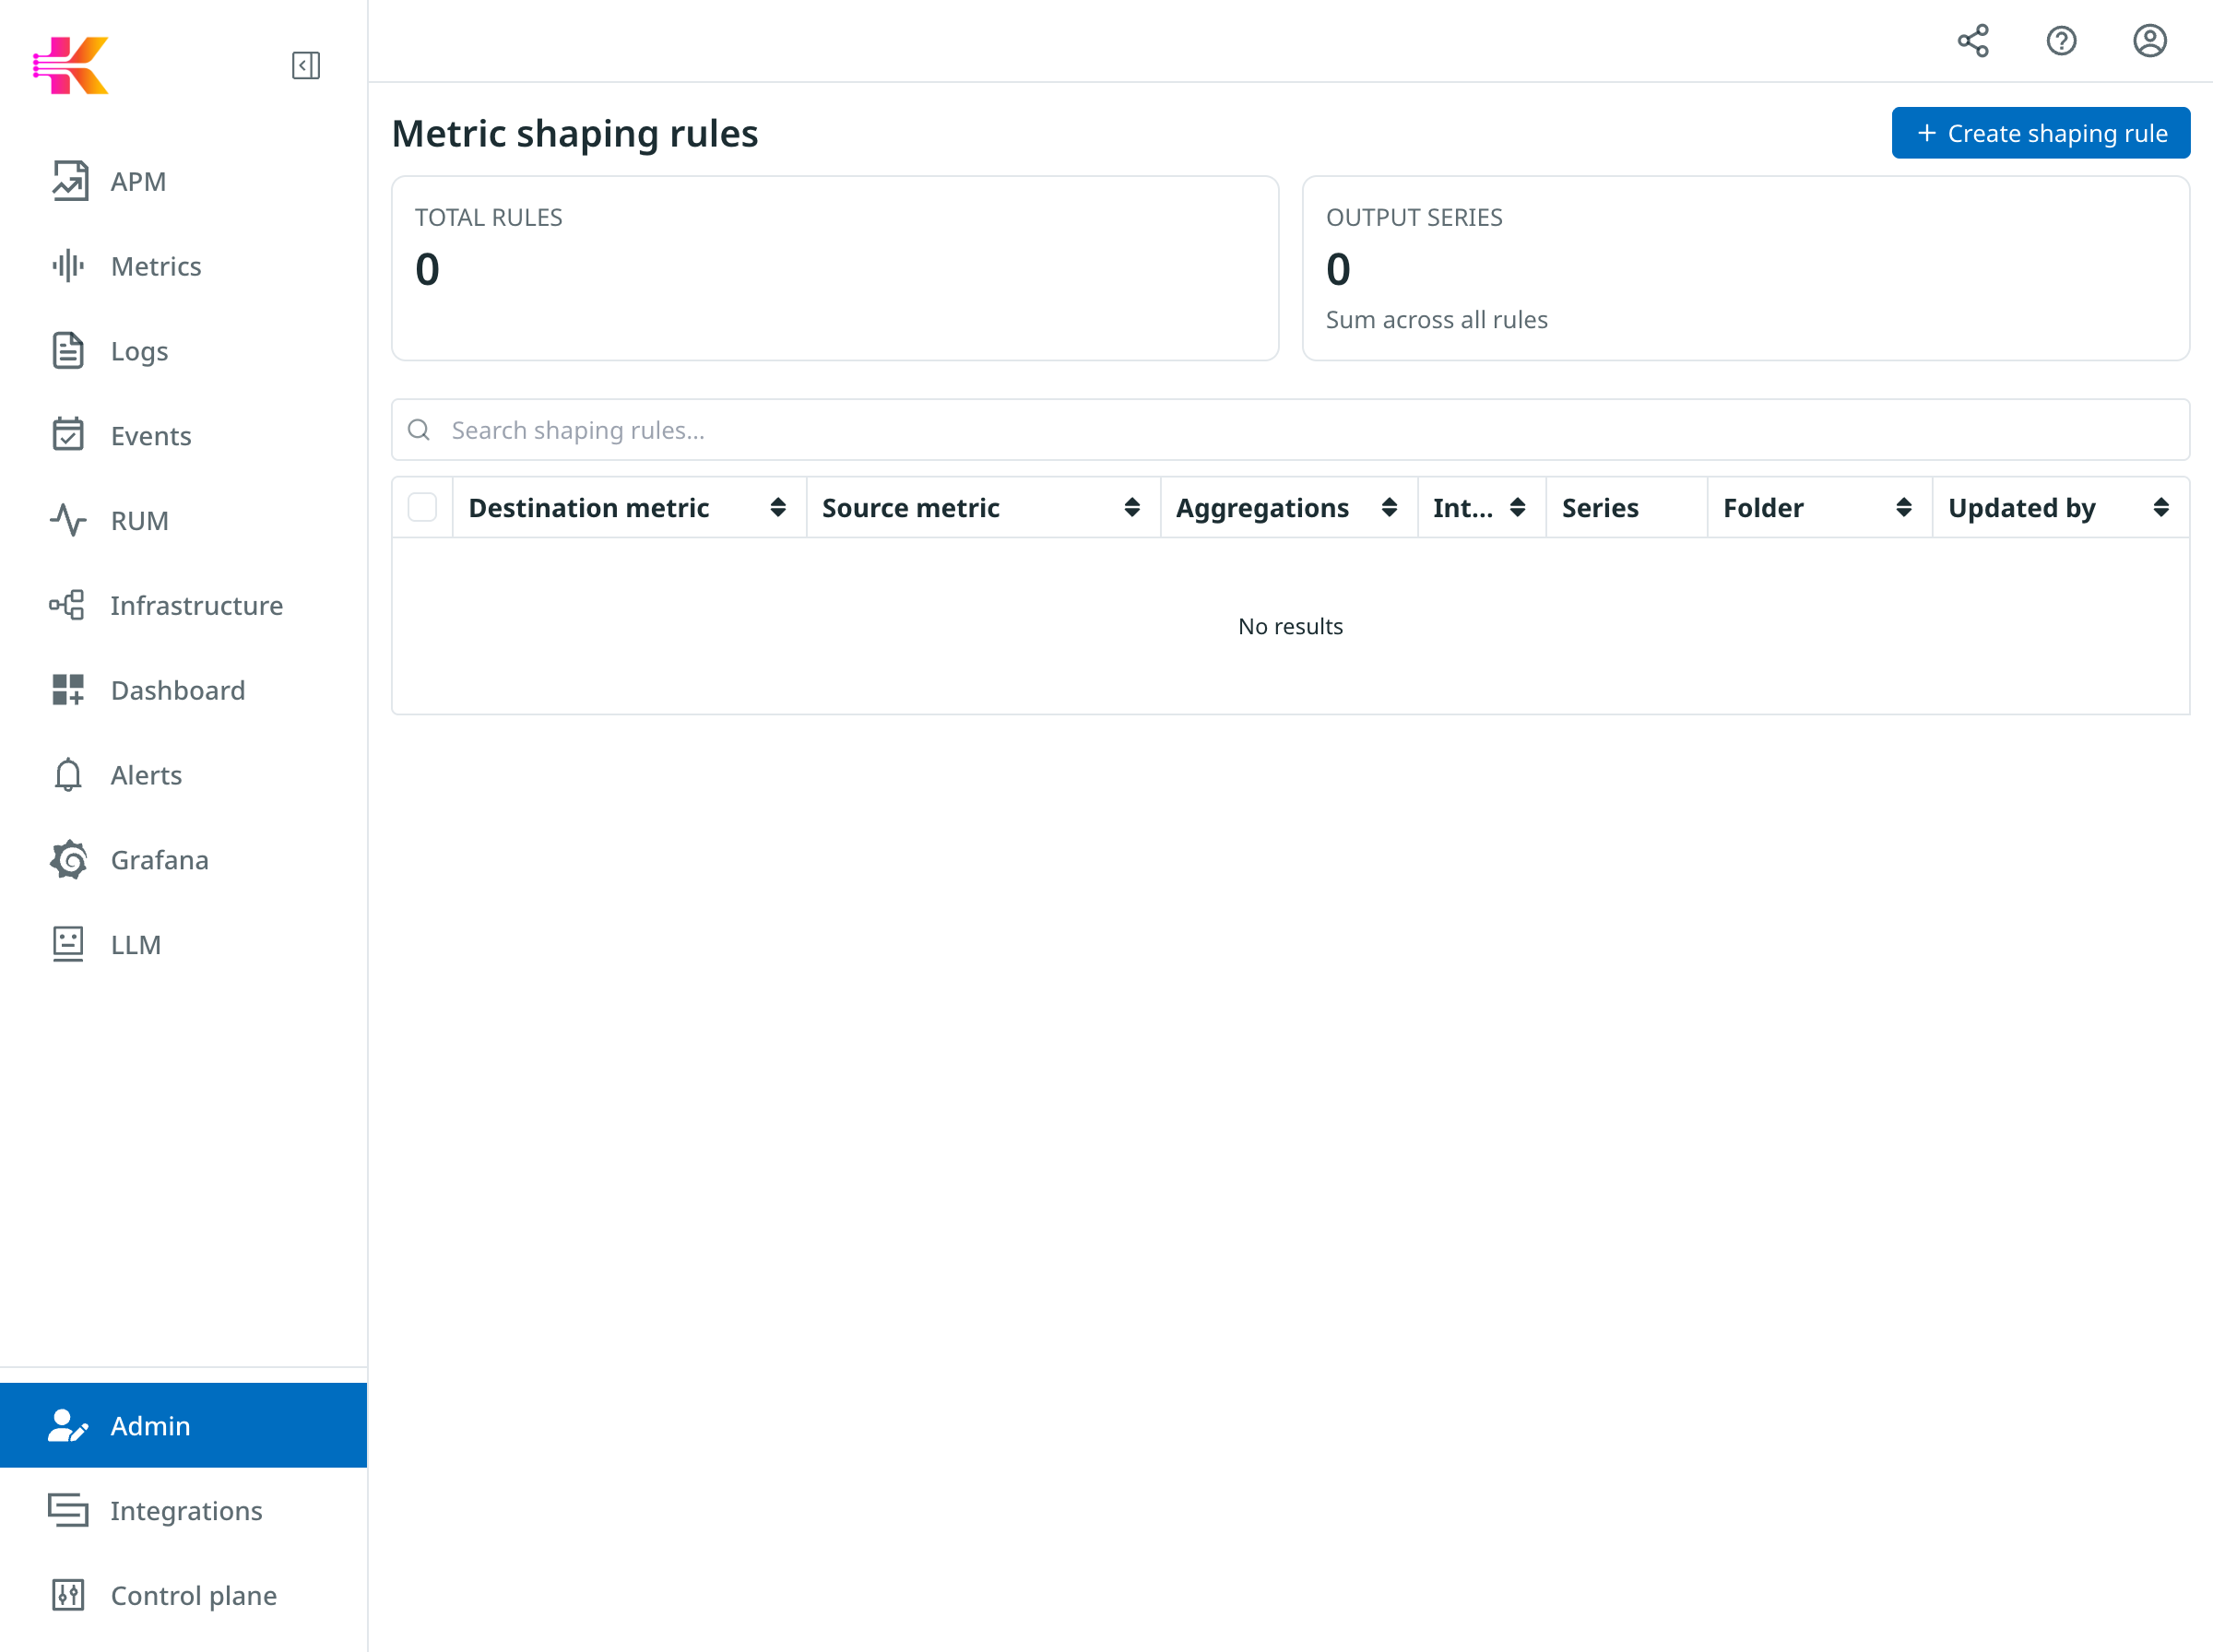
The shaping rules page opens. The first time you visit, the list is empty:
-
Create shaping rule (top right): Opens the create form.
-
TOTAL RULES and OUTPUT SERIES stat cards: Show the running totals across all rules in the workspace.
-
Search box: Filter the list once you have rules.
-
Destination metric / Source metric / Aggregations / Interval / Series / Folder / Updated by columns: Show the rules' configuration and live cardinality.
Create a shaping rule
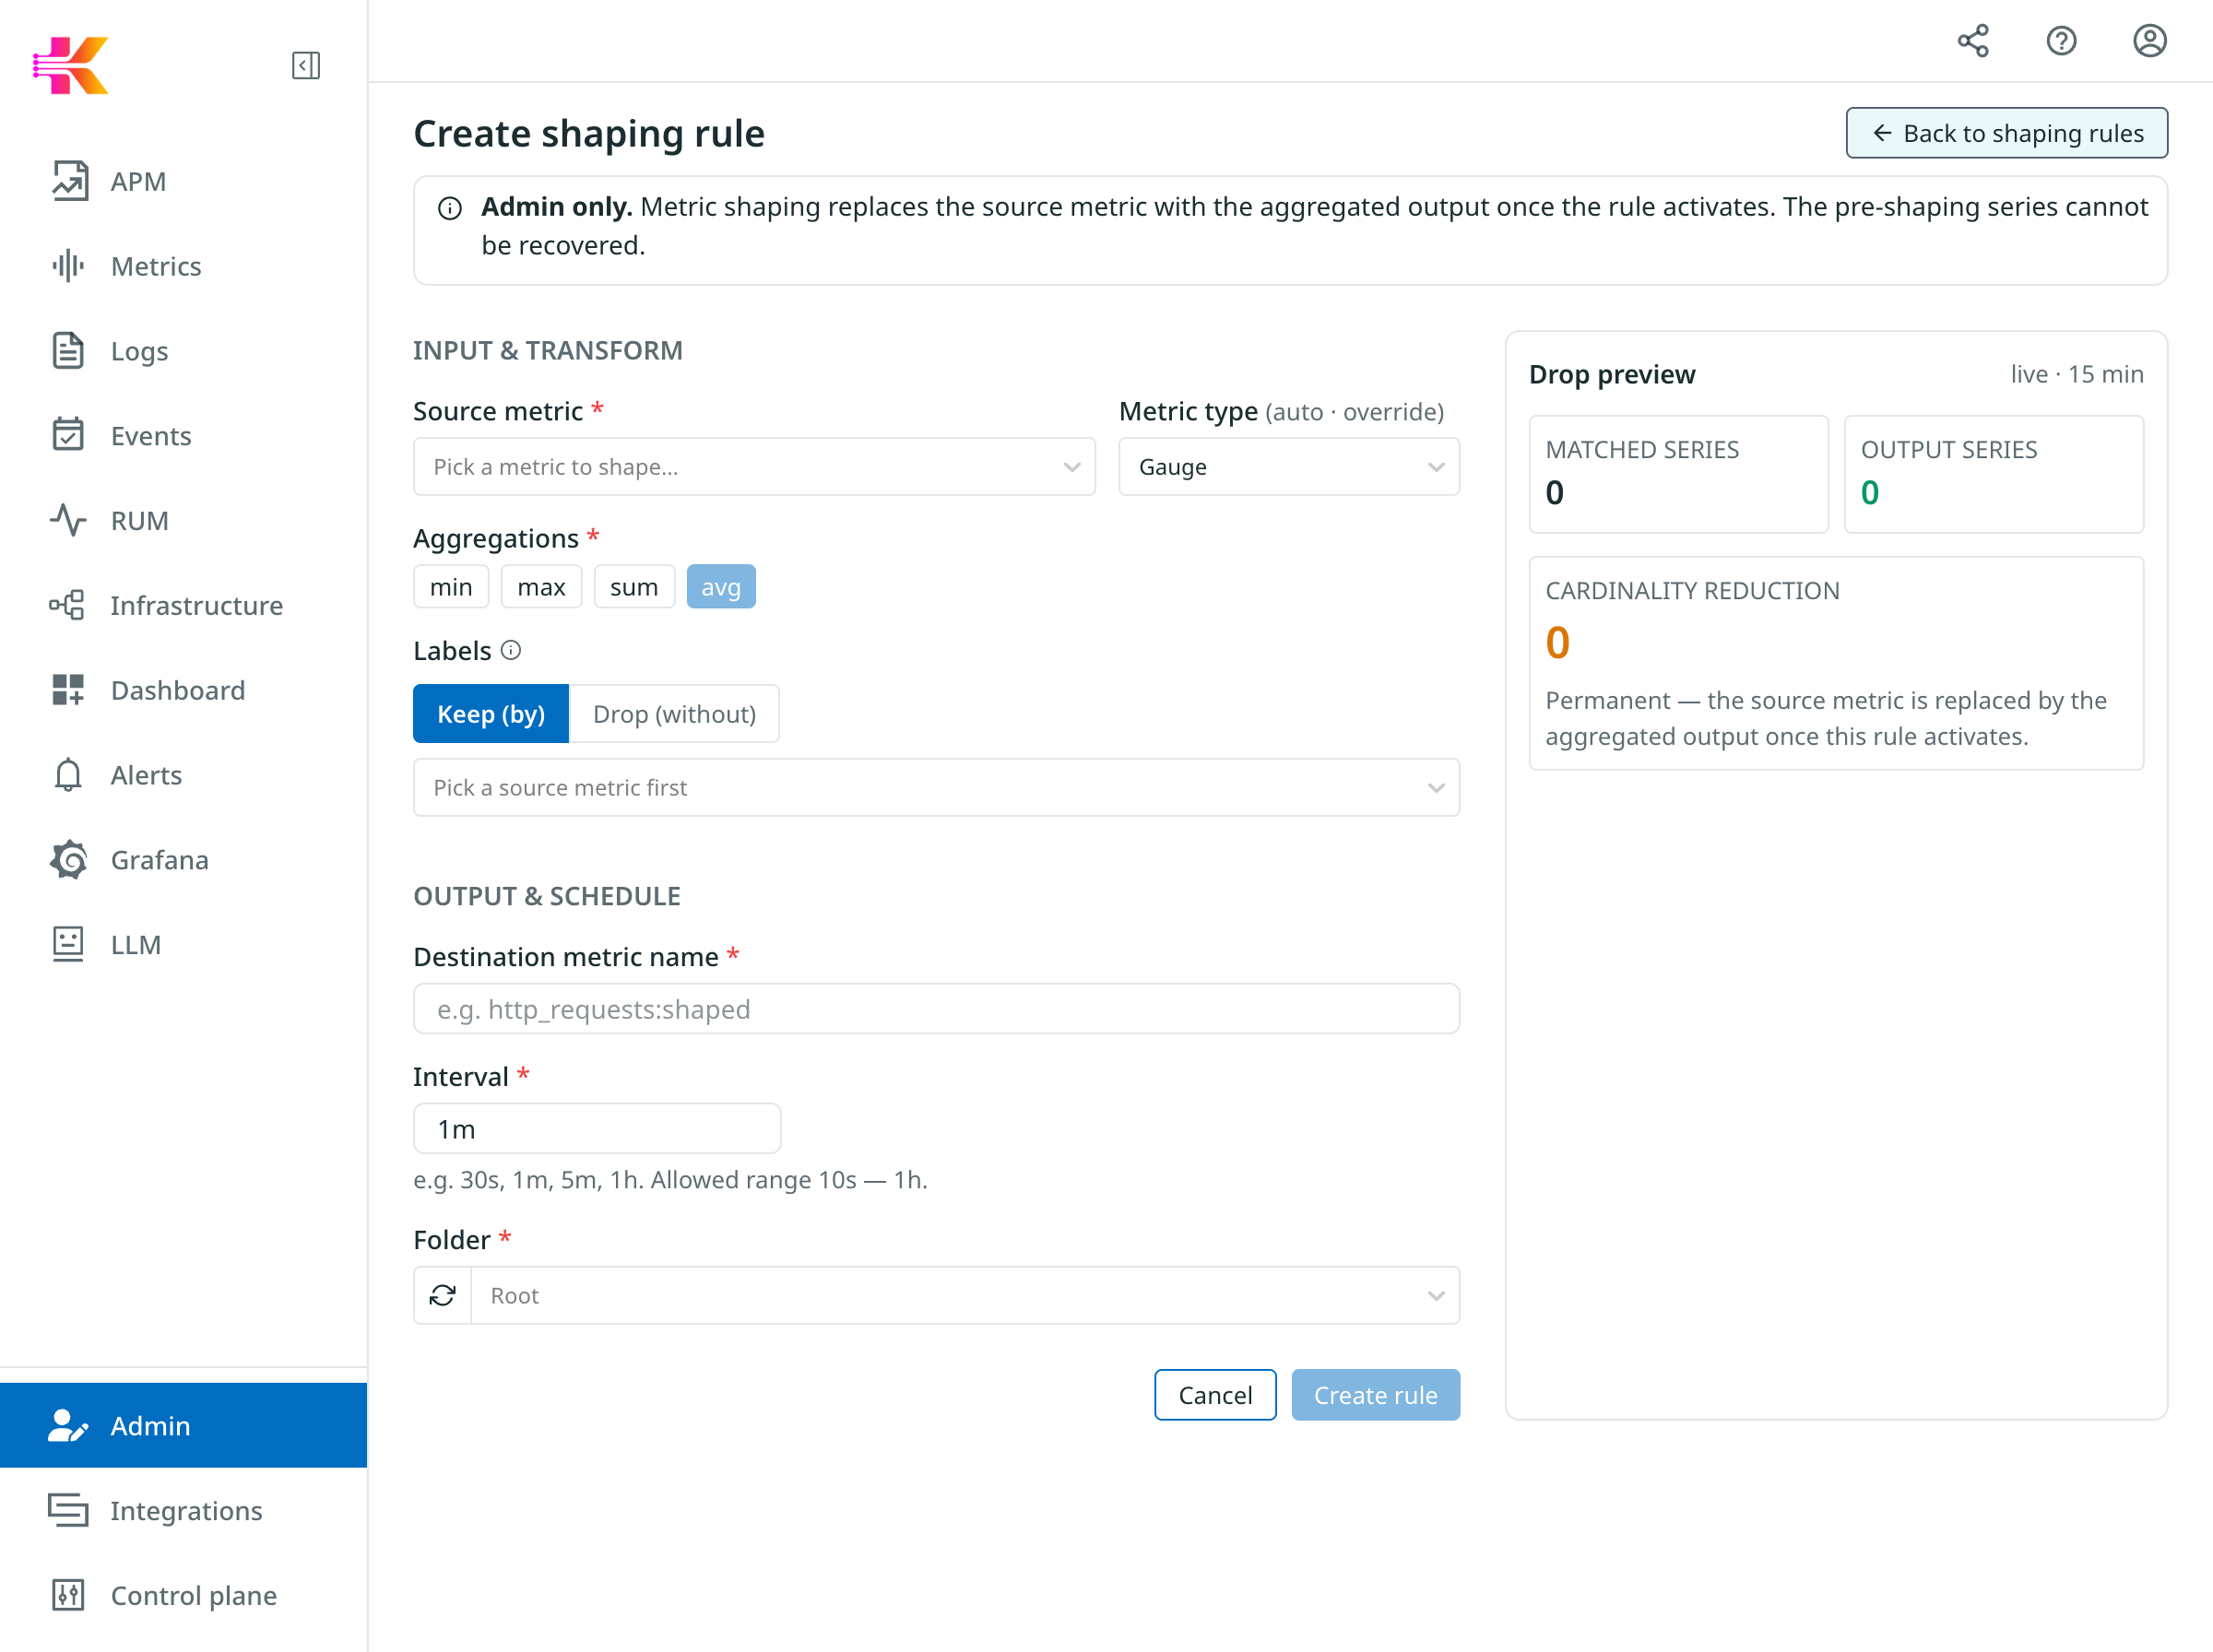
Click Create shaping rule. The form has two main sections — INPUT & TRANSFORM (what to aggregate and how) and OUTPUT & SCHEDULE (what to call the result and how often to evaluate). A right-hand Drop preview sidebar tells you the live cardinality before you commit.
|
Shaping is destructive by default. The banner at the top of the create form reads: "Metric shaping replaces the source metric with the aggregated output once the rule activates. The pre-shaping series cannot be recovered." Pick the source metric carefully. |
Fields
| Field | Description | Required |
|---|---|---|
Source metric |
The metric you want to shape. The picker autocompletes from the metrics currently flowing through Kloudfuse. |
Yes |
Metric type |
The shape of the source metric: Counter, Gauge, Classic histogram, or Native histogram. Auto-detected from the source metric’s metadata; you can override if the detection is wrong. |
Yes (auto) |
Aggregations |
One or more functions to compute. The set offered depends on the metric type — gauges and counters get |
Yes (one or more) |
Labels + Keep/Drop toggle |
Which labels survive into the output series. Keep (by) keeps only the listed labels; Drop (without) drops the listed labels and keeps the rest. On classic histograms, Drop (without) is disabled — the platform requires Keep (by) so the |
No (default = collapse everything) |
Destination metric name |
The name of the new series the rulemanager will produce. Must be a valid Prometheus metric name. Auto-derived from the source name; override to taste. |
Yes |
Interval |
How often the rule re-evaluates. Accepts Prometheus duration strings ( |
Yes (defaults to |
Folder |
The folder this rule belongs to. Metric shaping is admin-only, so the folder is purely a grouping/organization key — it does not grant non-admins any access. |
Yes |
|
Rules in the same folder with the same interval are placed into a single Prometheus rule group, which means they evaluate sequentially — one after the other on each tick. If you have many heavy rules sharing a folder + interval, the group’s total evaluation time can exceed the interval itself and rules will start to fall behind. Spread heavy rules across different folders (or use different intervals) to let them evaluate in parallel. |
Drop preview
As you pick a source metric and the labels to keep, the Drop preview sidebar updates in real time:
-
MATCHED SERIES: how many series the source metric currently has (in the last 15 minutes).
-
OUTPUT SERIES: how many series the shaped output will produce, given the aggregations and labels you picked.
-
CARDINALITY REDUCTION: the absolute and percentage reduction.
Use this to validate the rule before submitting. If your aggregations and group-by selection only knock the series count down by 10–20%, you may have picked labels that don’t actually concentrate cardinality. Try dropping a higher-cardinality label like pod_name or instance and the reduction usually jumps.
Example: shape a classic-histogram tool-latency metric
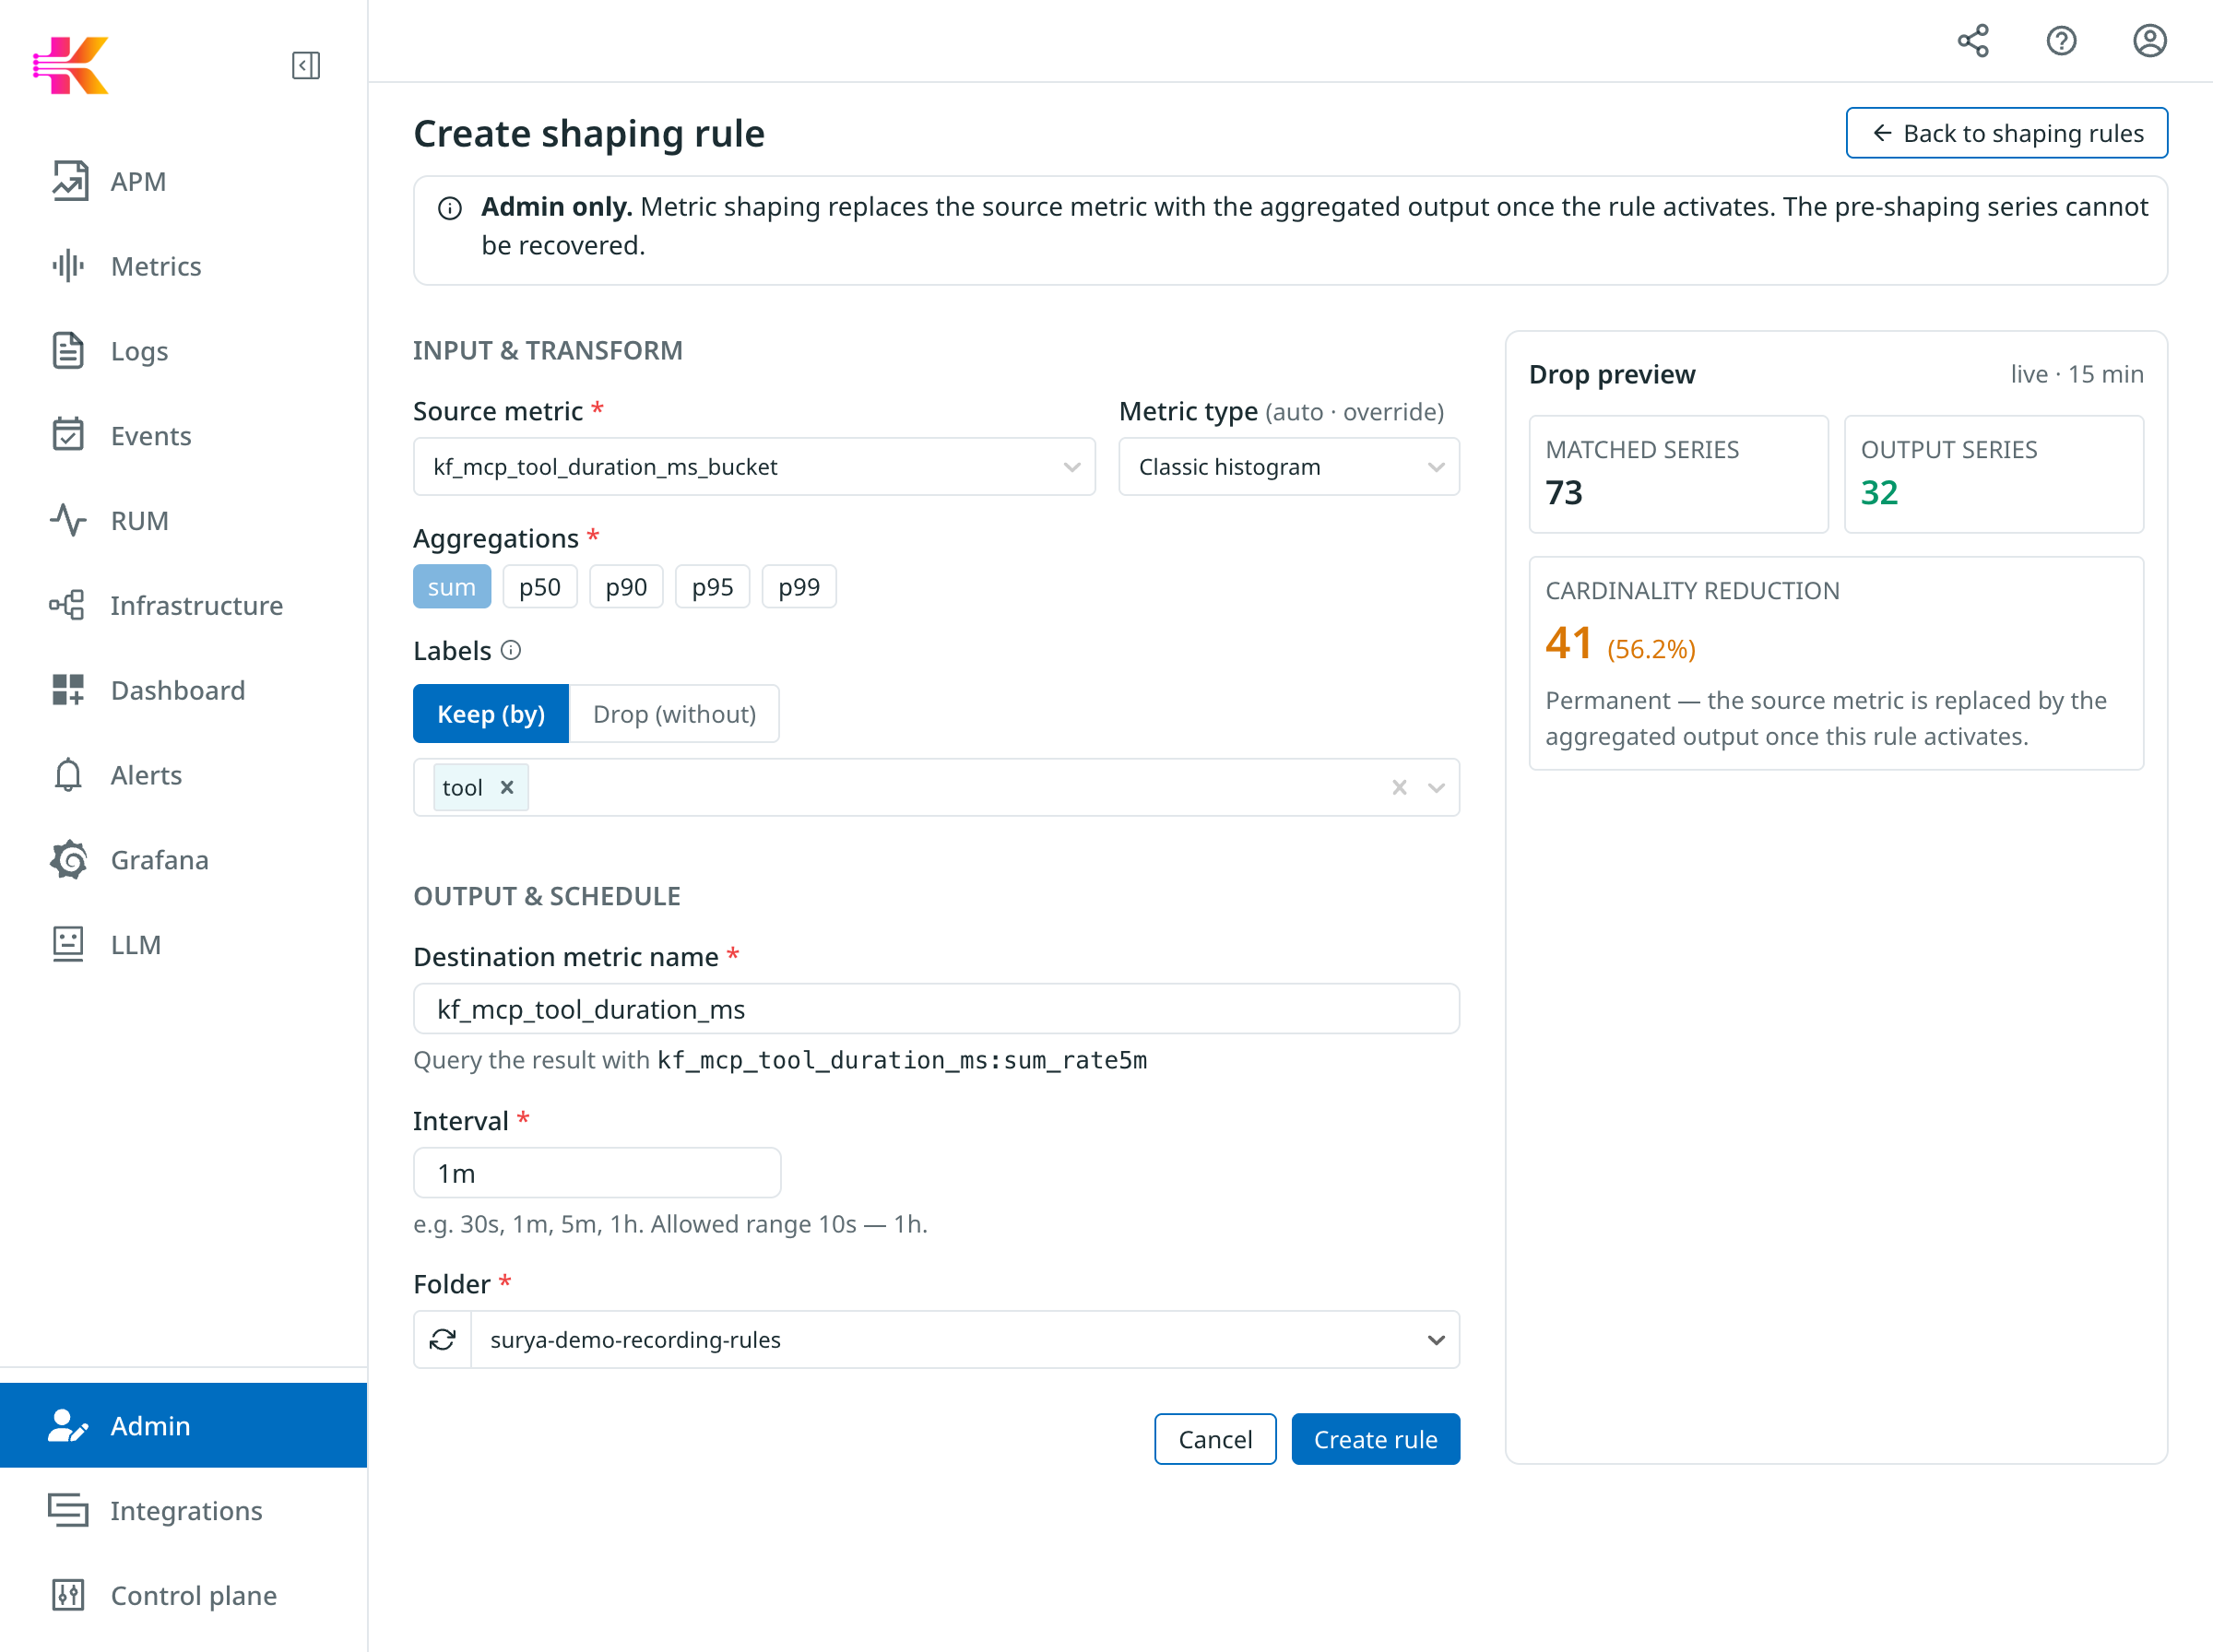
This example shapes kf_mcp_tool_duration_ms_bucket (a classic histogram with le, tool, pod_name, kube_namespace, and several other labels) down to just (le, tool) per output series. The tool label here is a label on the source metric that identifies which MCP tool emitted the timing — e.g. query_prometheus, get_alert_summary, search_logs — so each output series ends up as one tool’s latency-bucket histogram.
-
Open Admin > Settings > Shaping rules and click Create shaping rule.
-
In Source metric, type
kf_mcp_tool_duration_ms_bucketand pick it from the dropdown.The form auto-detects the metric type as Classic histogram, surfaces classic-histogram-appropriate aggregations (
sum,p50,p90,p95,p99), and disables Drop (without) solecannot be accidentally dropped. -
Pick
sumas the aggregation. -
Click Keep (by) and add
toolto the Labels picker.The Drop preview updates: 73 matched → 32 output serieses, a 56.2% cardinality reduction. The
lelabel is kept automatically (you don’t need to add it). -
(Optional) Override the Destination metric name if the auto-derived name isn’t to your taste. The default is the source name with the aggregation suffix.
-
Pick your folder from the Folder dropdown.
-
Click Create rule.
The rule starts evaluating at the next interval and the new metric appears in the list:
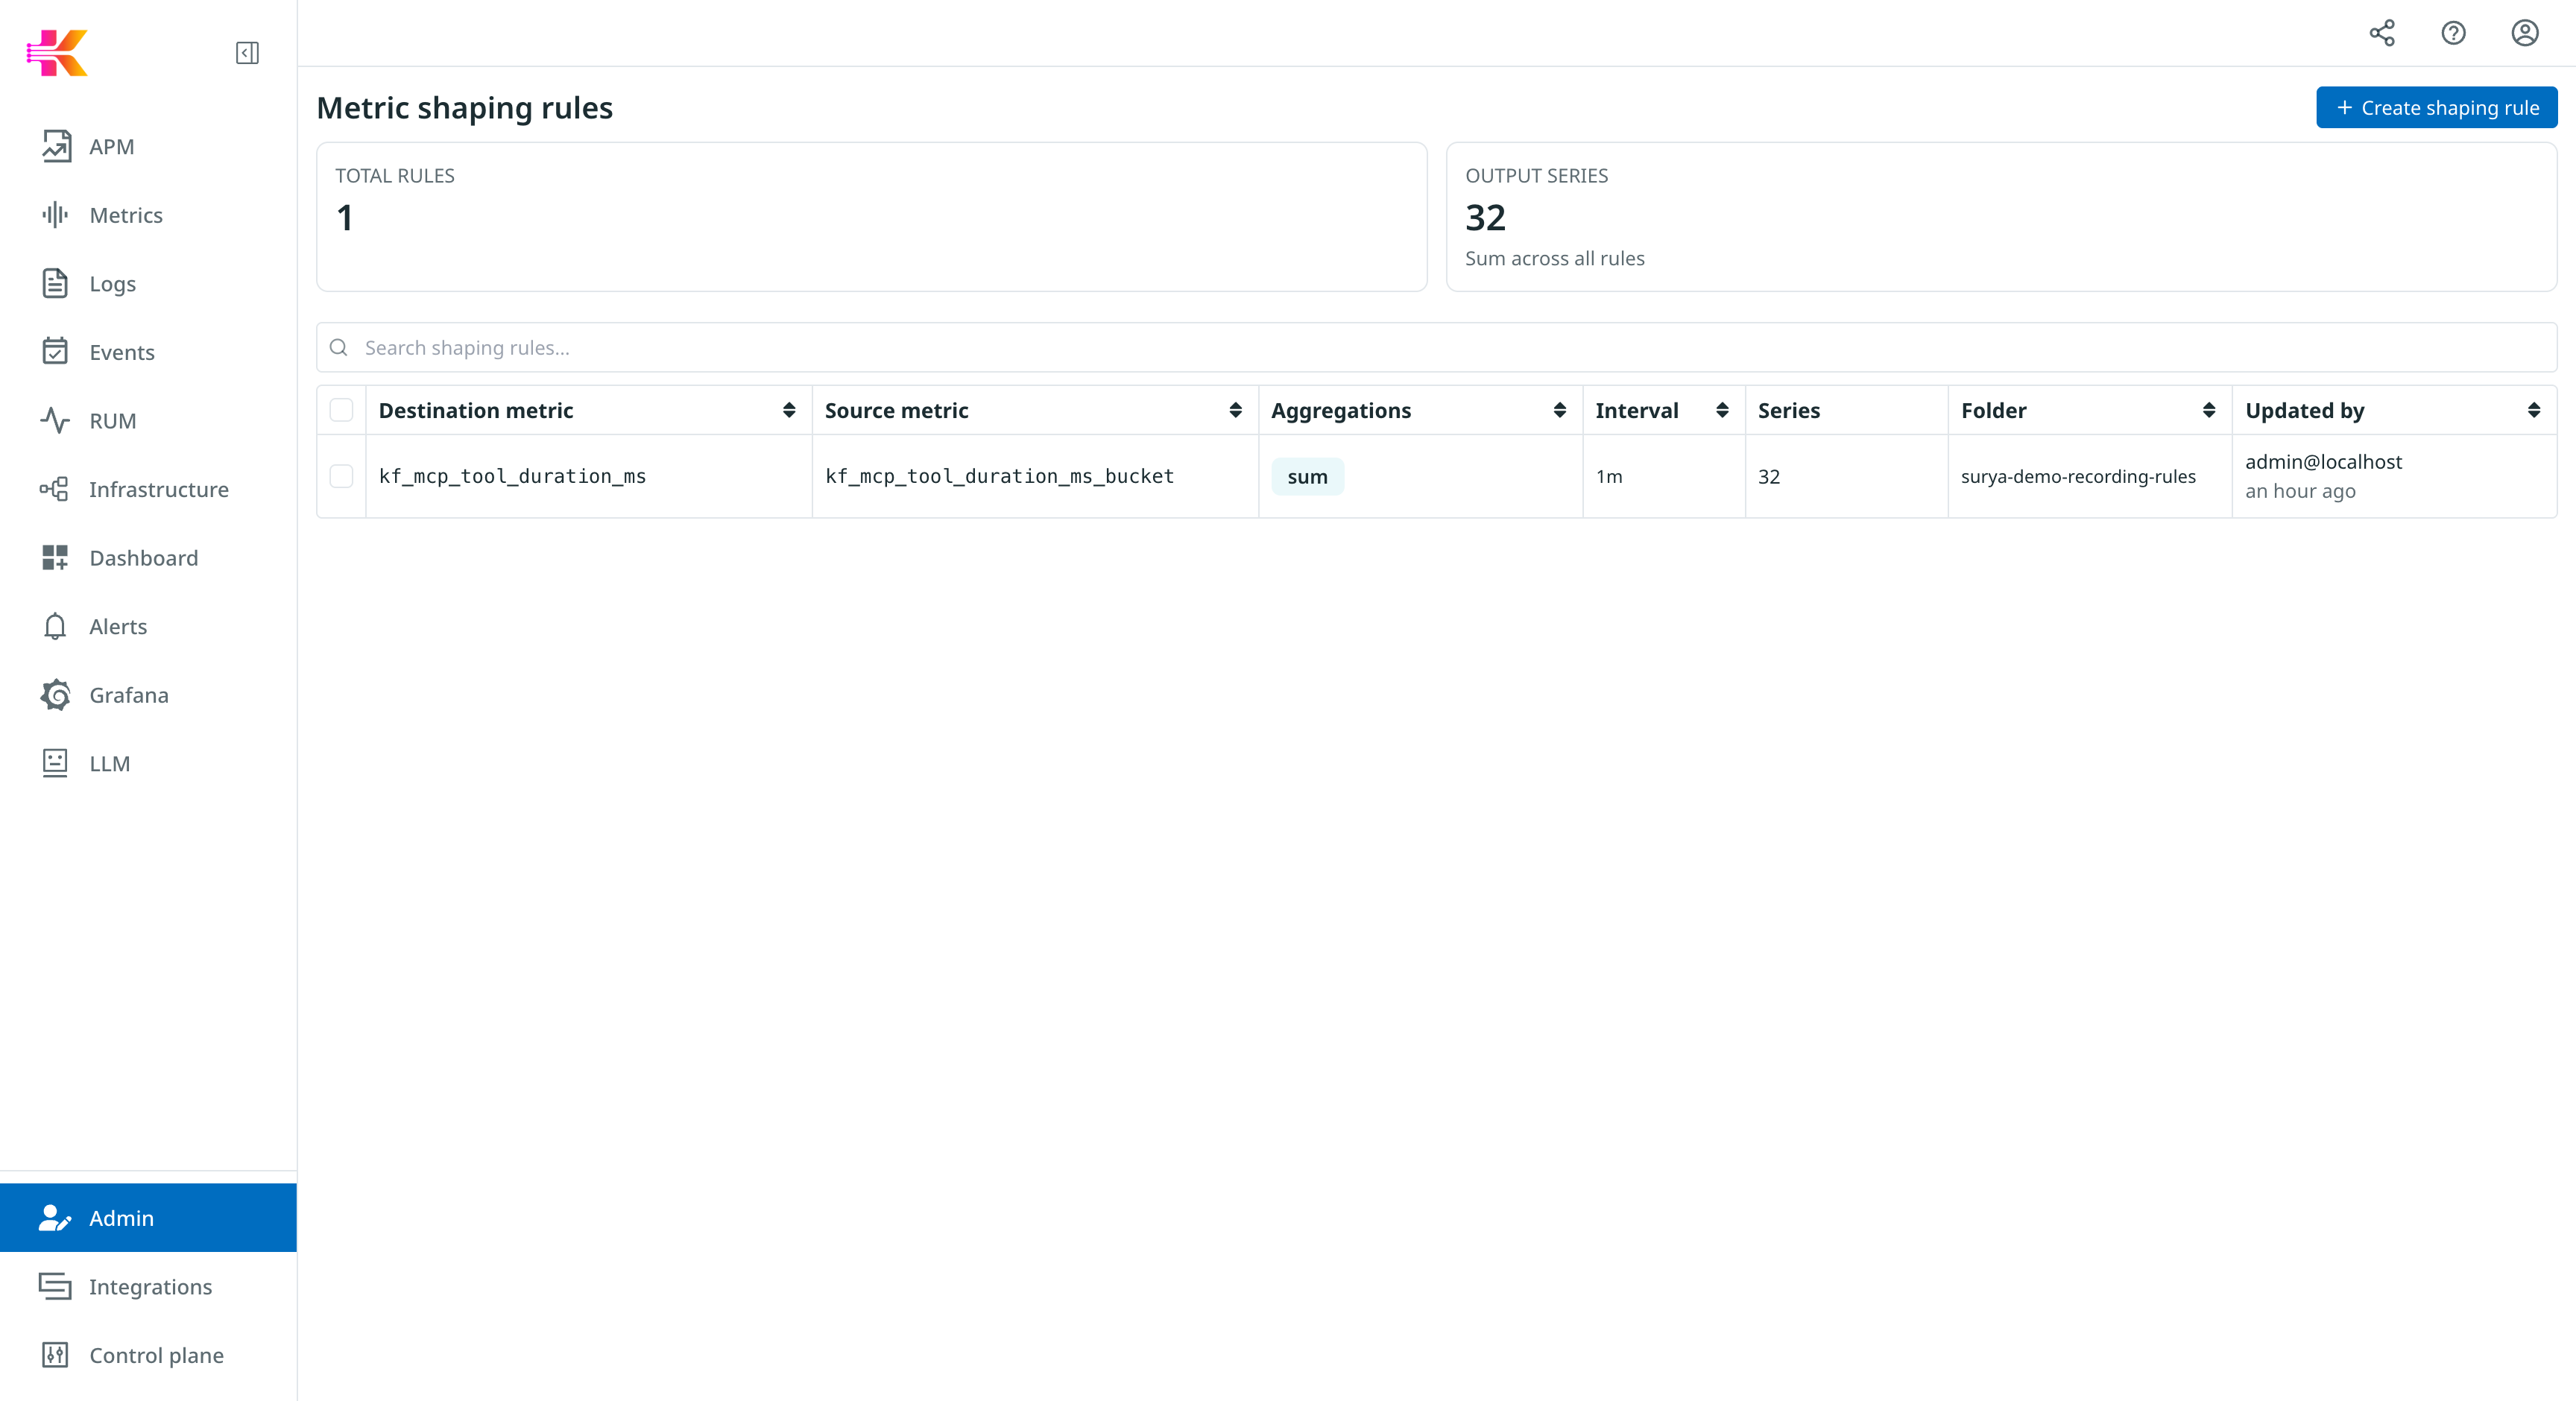
The list now shows TOTAL RULES: 1 and OUTPUT SERIES: 32 in the top stat cards, plus the destination metric, source metric, aggregations, interval, series count, and folder in the row.
Query the result
Once the rule has produced at least one sample (after one full interval), the shaped metric is queryable like any other:
kf_mcp_tool_duration_ms:sum{tool="query_prometheus", le="+Inf"}Because the rule keeps the le label, histogram_quantile works against the shaped series exactly the same way it would against the original _bucket metric:
histogram_quantile(0.95, sum by(le, tool) (rate(kf_mcp_tool_duration_ms:sum[5m])))To validate that the shaped output is functionally equivalent to the source, place them side by side in a dashboard with the same aggregation applied to each:
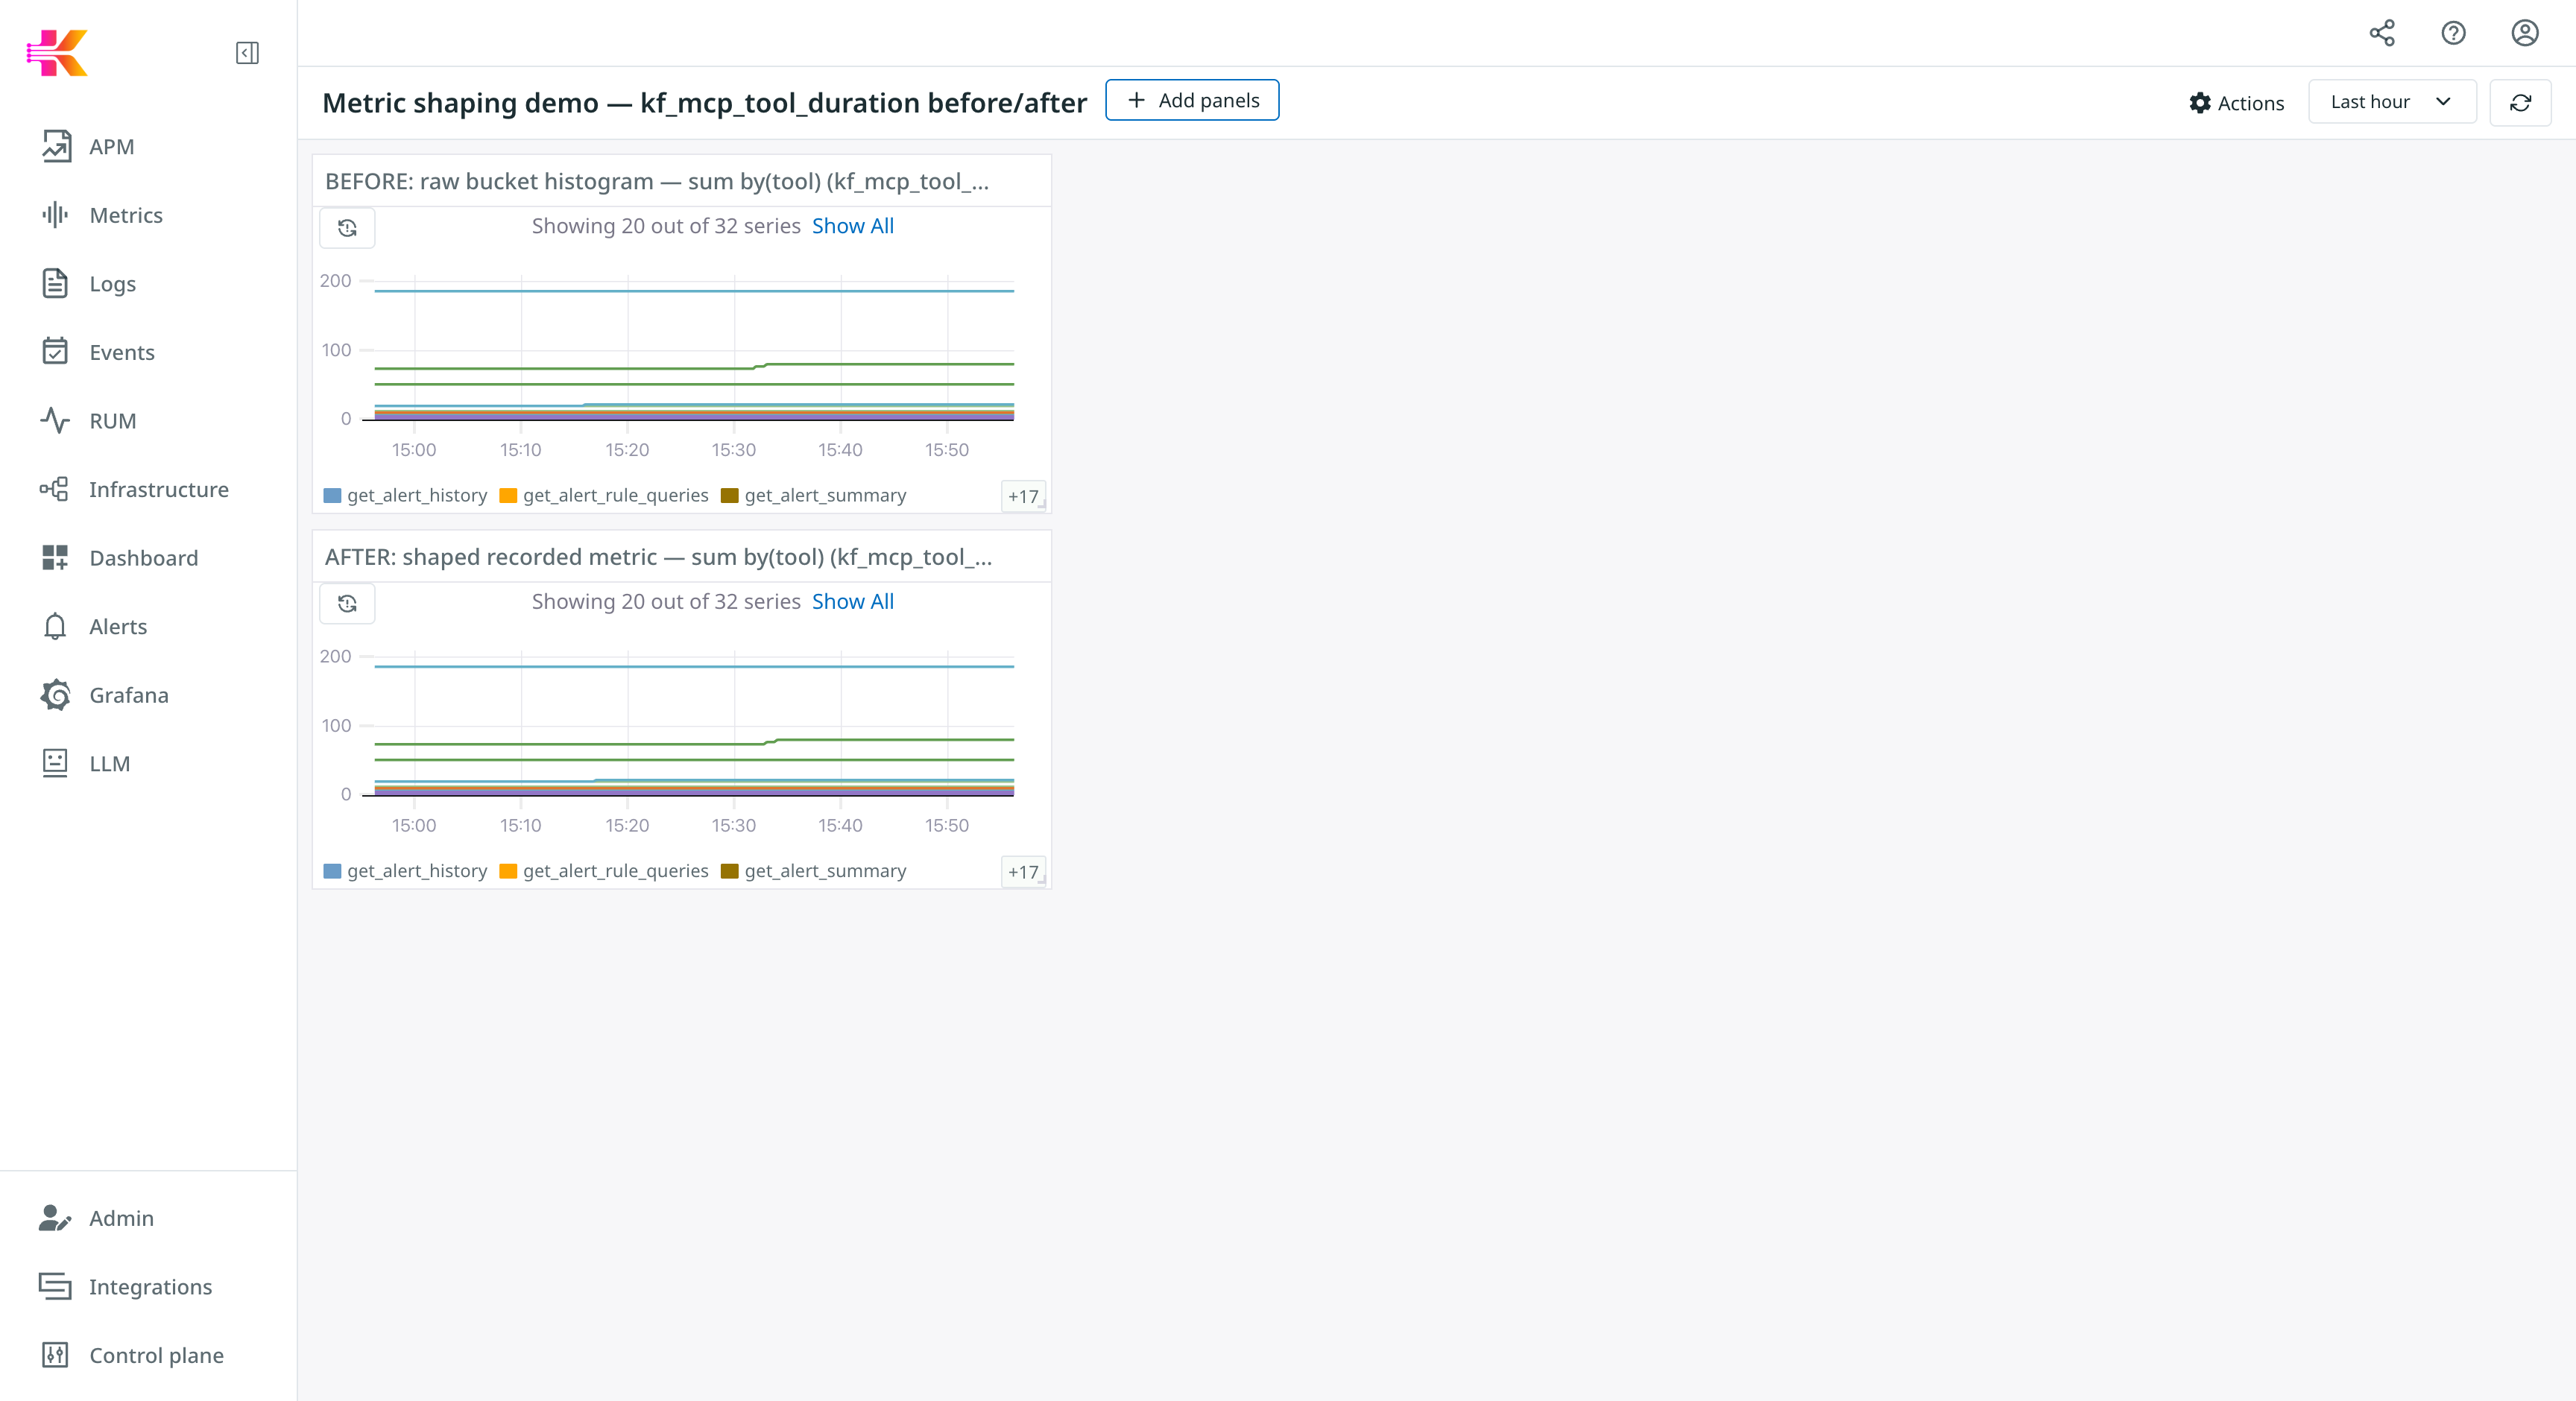
In the screenshot, both panels run sum by(tool) (…) against their respective metric. Both produce 32 serieses (one per tool) with matching values — confirming the shaped metric carries the same information, just with the high-cardinality labels (pod_name, kube_namespace, etc.) aggregated away.
Output metric types and how to query them
The aggregation you pick determines the type of the shaped output, which in turn dictates how downstream dashboards and alerts must query it. The result of every shaping rule is a sample stored at the rule’s evaluation interval — so anything that resembled a "cumulative counter" upstream becomes a gauge of point-in-time samples downstream unless sum is used (which preserves the counter shape per kept-label combination).
The table below summarises the recipe per aggregation. Replace <output> with your destination metric name, <labels> with the labels you kept, and <interval> with the rule’s evaluation interval.
| Source metric type | Aggregation | Output metric type | Sample query |
|---|---|---|---|
Counter |
|
Counter (cumulative, one series per kept-label combo) |
|
Counter |
|
Gauge (snapshot of the aggregate at each tick) |
|
Gauge |
|
Gauge |
|
Classic histogram ( |
|
Counter histogram (bucket-by-bucket sum, |
Percentiles: |
Classic histogram |
|
Gauge (pre-computed quantile per kept-label combo) |
|
Native histogram |
|
Gauge (pre-computed quantile) |
|
|
The general rule: if your aggregation breaks the cumulative property of the source (anything except |
Edit, pause, or delete a rule
From the shaping rules list, click into a rule’s row to open its details. From there, you can:
-
Edit — change the aggregations, group-by labels, interval, folder, or destination name.
-
Pause — stop the rule from evaluating without losing its configuration. Existing samples remain queryable; no new samples are produced. The original source metric resumes flowing into storage at full cardinality until you resume the rule.
-
Resume — re-enable a paused rule.
-
Delete — permanently remove the rule. The shaped metric stops accumulating new samples; historical samples remain queryable until they age out of retention. The source metric flows at full cardinality again from that point on.
Troubleshooting
The Drop preview shows 0 matched serieses
The source metric hasn’t emitted any samples in the last 15 minutes. Either the source isn’t flowing, or there’s a typo in the source-metric picker. Use the metrics explorer (menu:Metrics[Explorer]) to confirm the source is alive before retrying.
A specific aggregation button is greyed out
Some aggregations don’t make sense for the chosen metric type. For example, on classic histograms avg/min/max/count are unavailable because they don’t produce a metric you can run histogram_quantile against. Pick a metric-type-appropriate aggregation — or change the Metric type override if you believe the auto-detect is wrong.
The shaped metric doesn’t show up in the dashboard panel picker right away
The metric picker reads from a cache that refreshes on a delay. A newly-created shaped metric may take a few minutes to autocomplete. In the meantime, the metric is still queryable — type the full name in the metric box, or use it directly in a PromQL expression.
I picked the wrong source metric and want the pre-shaping series back
The pre-shaping series cannot be recovered. Once shaping activates, the source metric is replaced by the aggregated output. Going forward, deleting the shaping rule will restore full-cardinality samples for that metric from that point on — but no historical full-cardinality data will return.
See also
-
Derived Metrics — for caching an arbitrary PromQL expression as a new metric without touching the original.
-
Metrics Cardinality Explorer — find which metrics and labels drive cardinality so you know what’s worth shaping.
-
Histogram — for background on classic vs. native histograms and how
lelabels work.
