Release Notes
- 4.2.1 (Latest)
- 4.2.0
- 4.1.0
- 4.0.2
- 4.0.1
- 4.0.0
- 3.5.3-p1
- 3.5.3
- 3.5.2-p2
- 3.5.2-p1
- 3.5.2
- 3.5.1-p2
- 3.5.1-p1
- 3.5.1
- 3.5.0
- 3.4.4-p1
- 3.4.3
- 3.4.2-p1
- 3.4.2
- 3.4.1
- 3.4.0-p2
- 3.4.0
- 3.3.6
- 3.3.5
- 3.3.4
- 3.3.3
- 3.3.2
- 3.3.1
- 3.3.0
- 3.2.5
- 3.2.4
- 3.2.3
- 3.2.2
- 3.2.1
- 3.2.0
- 3.1.3
- 3.1.2
- 3.1.1
- 3.1
- 3.0
- 2.7.4
- 2.7.3-p2
- 2.7.3-p1
- 2.7.3
- 2.7.2
- 2.7.1
- 2.7.0
- 2.6.7-p1
- 2.6.7
- 2.6.5
- 2.6.0
- 2.5.4
- 2.5.3
- 2.5.2
- 2.5.1
- 2.5.0
- 2.2.4
- 2.2.3
- 2.2.2
- 2.1.0
- 2.0.0
- 1.3.4
- 1.3.3
- 1.3.2
- 1.3.1
- 1.3.0
This page documents the features, enhancements, and fixes included in each Kloudfuse platform release.
4.2.1 (Latest)
June 17, 2026
This release delivers targeted bug fixes across FuseQL, LogsV2, dashboards, APM, scheduled searches, and logs ingestion stability.
Additionally, we fixed a number of issues. See the bugs we fixed in this release.
To upgrade to this release, see Upgrade Kloudfuse, and Upgrade to 4.2.1.
4.2.0
June 1, 2026
This release introduces metric shaping rules and derived metrics, a new scheduled search feature, an improved and unified logs experience, a high-performance and scalable archive writer, and new query scheduling controls.
Additionally, we fixed a number of issues. See the bugs we fixed in this release.
To upgrade to this release, see Upgrade Kloudfuse, and Upgrade to 4.2.0.
Metrics
- Metric Shaping Rules
-
You can now reduce a high-cardinality metric’s series count by aggregating it down to the labels you actually query, and store the result as a new recorded metric. Dashboards and alerts read the smaller shaped metric instead of the full-cardinality metric, so they run faster and cost less. The original metric is always dropped.
- Derived Metrics
-
You can now precompute a PromQL expression on a fixed interval and store the result as a brand-new metric that dashboards and alerts can query directly. Expensive aggregations and histogram percentiles become cheap to read, and the original source series are always preserved.
Scheduled Searches
- Scheduled Searches
-
Save a log query and run it automatically on a planned schedule, with results delivered as an email or written to a lookup table. Email delivery includes a preview of the result table and attaches the full results as a CSV; lookup-table delivery can either merge with the existing table or replace it completely. Results are delivered at each scheduled tick when the configured conditions or thresholds are met. Scheduled searches follow folder RBAC rules, so anyone with the appropriate folder permissions can create, edit, delete, pause, and resume them.
Query Scheduling
- Blocked Query Priority and Fair Scheduling
-
We have improved query scheduling, first introduced in 4.1.0. A new blocked query priority lets administrators fully deny queries from a specific user, group, or service account; blocked queries are rejected instead of being delayed or queued. Query scheduling now round-robins across distinct callers within each priority tier, so a single noisy user can no longer crowd out others at the same priority.
4.1.0
May 6, 2026
This release introduces user-facing auth-key management, query scheduling controls, RUM and APM cross-navigation, MCP server improvements, and an experimental refresh of the Logs experience powered by FuseQL.
Additionally, we fixed a number of issues. See the bugs we fixed in this release.
To upgrade to this release, see Upgrade Kloudfuse, and Upgrade to 4.1.0.
Auth Keys
- Auth Key Management
-
Administrators can now create, view, label, and manage auth keys directly from the UI, with new auth-key APIs and label support across the backend. Auth-key expiration is interpreted as local end-of-day with the active timezone shown alongside the value. See Ingestion Authentication with API Key.
Query Scheduling
- Query Interleaving
-
Pinot segment workers now continuously pull and process individual segments from a shared scheduler instead of being dedicated to a single query for its full lifetime. Work from concurrent queries is interleaved across the worker pool, so small queries no longer wait behind large queries' segment scans. Enabled by default in 4.1.0; see Query Interleaving.
- Query Priority Controls
-
Per-user and per-service-account query priorities can now be configured from the admin UI, with priority and timeout APIs available for users and service accounts. Priority is propagated end-to-end into the query path so high-priority workloads are scheduled ahead of background queries. See Query Priorities.
RUM and APM
- RUM to Trace Cross-Navigation
-
Traces and RUM events are now linked end-to-end. New tabs surface RUM and Trace context side by side, an optional column lists resources that have associated traces, and the ingester recognizes the latest browser SDK trace headers so the linkage works for newly captured sessions. See Connect RUM and Traces.
MCP
- Kloudfuse MCP Improvements
-
The Kloudfuse MCP server gains per-connection toolset selection (via
?toolsets=), a redesigned alerts toolset, typed Pydantic filters across logs, events, infrastructure, RUM, and APM tools, a docs search and retrieval toolset, and a verb-first naming convention across all tools. A Prometheus/metricsendpoint and scrape annotations make the server self-observable.
Infrastructure
EnableDebugPlaygroundFlag-
A new top-level umbrella flag (default
true) controls whether per-service GraphQL playground UIs are exposed at/debug/<service>/playground. Disable the flag incustom_values.yamlfor hardened or production deployments where the playgrounds should not be reachable:global: EnableDebugPlayground: falseyaml
Logs
- Logs V2 (Experimental)
-
A major refresh of the logs experience, with a redesigned logs tab, a FuseQL-powered logs API across the platform, and a refreshed analytics surface. Logs V2 is available as an experimental experience in 4.1.0 and can be enabled on request — contact Kloudfuse support to opt your tenant in.
- FuseQL Enhancements
-
FuseQL now supports a
topkoperator, math expressions insideif(…)value branches, and_viewreferences inwhereandifpredicates.
4.0.2
April 22, 2026
This patch release includes performance improvements to Pinot segment preload, a new parseDate FuseQL function, and several customer-impacting bug fixes across the UI, ingestion, query, and security layers.
Additionally, we fixed a number of issues. See the bugs we fixed in this release.
To upgrade to this release, see Upgrade Kloudfuse, and Upgrade to 4.0.2.
FuseQL
parseDateFunction-
Added a new
parseDate(dateString, pattern[, timezone])FuseQL function that converts date strings to epoch milliseconds. The function is pushed down to Pinot when supported, with a Go-evaluator fallback for ISO 8601 offset patterns. Defaults to UTC when a timezone is not specified.
4.0.1
April 10, 2026
This patch release includes bug fixes for logs, alerts, metrics, APM, and ingestion.
See the issues we fixed in this release.
To upgrade to this release, see Upgrade Kloudfuse, and Upgrade to 4.0.1.
Metrics
- Anomaly Forecast Bounds
-
Fixed an issue where anomaly forecast bounds were not displayed in the Metrics Explorer when querying a metric without an aggregation function.
- Metrics Explorer Formula Stats
-
Fixed an issue where the Metrics Explorer did not display query statistics when using formula-only queries.
4.0.0
March 26, 2026
This major release introduces unique log IDs for deterministic sorting and downloads, Envoy Gateway support as an alternative ingress controller, FIPS 140-3 compliance with STIG hardening, faster parallel log hydration, log query performance improvements, SLO versioning, and dashboard and alert improvements.
Additionally, we fixed a number of issues. See the bugs we fixed in this release.
To upgrade to this release, see Upgrade Kloudfuse, and Upgrade to 4.0.0.
Logs
- Unique Log IDs
-
Every ingested log line now receives a unique identifier at ingestion time, regardless of agent type or ingestion source. Log IDs enable deterministic sorting and consistent ordering of log results.
- Sort by Any Column
-
Log query results can now be sorted by any column, including timestamp and extracted facets. In the query builder, click any column header to sort. In FuseQL mode, use the
sort byclause. Sorting works in the logs list view, analytics table, and dashboard log panels. The selected sort order is preserved when switching between query builder and FuseQL editor modes, when saving queries to dashboards, and when creating alerts. FuseQL queries withsort bybefore aggregation operators are now also supported. - Sorted Log Downloads
-
Log downloads now respect the selected sort order, ensuring exported data matches what is displayed in the UI.
- Custom Column Persistence
-
Custom columns added in the query builder or via FuseQL column extraction now persist when switching between modes, and are no longer lost on sort or date range changes.
Envoy Gateway
- Envoy Gateway Support
-
Kloudfuse now supports Envoy Gateway with the Kubernetes Gateway API as an alternative ingress controller to NGINX Ingress. A zero-downtime 3-step migration path is available for existing deployments. See Configure Envoy Ingress for the installation and migration guide.
Hydration
- Faster Log Hydration
-
Log hydration is significantly faster with parallel processing. Multiple concurrent hydration jobs are now supported, jobs can be paused and resumed, and jobs gracefully handle schema changes across time ranges instead of failing. Note that this is only applicable to V2 archives. For V1 archives, hydration will still follow a sequential rehydration process.
Dashboards
- Table Sort Persistence
-
Dashboard table panels now persist the selected sort order across page reloads and dashboard saves.
- Stat Panel Improvements
-
Stat panels now support custom font sizes and display correct units.
- Default Time Range
-
Dashboards now support updating the default time range.
- Trace List Template Variables
-
Trace list panels in dashboards now support template variable filtering.
FIPS 140-3 Compliance
- FIPS 140-3 Validated Cryptography
-
All services now use FIPS 140-3 validated cryptographic modules for encryption. This release completes FIPS compliance by integrating validated cryptographic libraries across all services and enabling FIPS crypto policy at the operating system level.
- STIG Hardened Container Images
-
All container images have been migrated to Red Hat UBI9-minimal base images and STIG hardened, enabling deployment in regulated environments.
3.5.3-p1
March 11, 2026
This patch release includes bug fixes for scheduled views, dashboards, traces, metrics queries, and platform stability.
See the issues we fixed in this release.
To upgrade to this release, see Upgrade Instructions, and Upgrade to 3.5.3-p1.
Dashboards
- Confirmation Dialog Hidden Behind Side Panel
-
Fixed a regression where confirmation dialogs (such as adding a user to a folder) were hidden behind the side panel overlay.
- Chart Error Handling
-
Fixed an issue where dashboard charts did not properly display errors on the first query failure.
- Template Variables Not Refreshing
-
Fixed an issue where dashboard template variables were not updating when the date range was changed.
- Dashboard Filter Chain
-
Fixed an issue where chained dashboard template variables were not updating dependent filters when a parent filter was changed.
- Dashboard Text Filter Input
-
Fixed an issue where dashboard text filter inputs would revert to their previous value when attempting to edit or clear them.
- Logs Panel Scrolling
-
Fixed an issue where scrolling within a Logs dashboard panel moved the entire browser window instead of scrolling within the panel.
- Template Variable FuseQL Escaping
-
Fixed an issue where template variable values were not properly escaped in FuseQL queries.
Platform Stability
- Logs Parser Memory Growth
-
Fixed unbounded memory growth in the logs parser service in environments with frequent node recycling, which could lead to out-of-memory conditions over time.
- PostgreSQL Configuration
-
Fixed an issue where PostgreSQL
max_connectionswas reset to the default value of 100 during upgrades, potentially causing connection exhaustion under load.
3.5.3
March 1, 2026
This release introduces the Metrics Cardinality Explorer, multi-rollup resolution for metrics, historical data support for scheduled views, traces streaming, configurable SLO time windows, MCP server enhancements, multi-contact point notification policies for alerts, role isolation, enhanced pod security configuration, and numerous performance and reliability improvements. Additionally, we fixed a number of issues. See the bugs we fixed in this release.
To upgrade to this release, see Upgrade Kloudfuse, and Upgrade to 3.5.3.
Role Isolation
Kloudfuse services can now be separated onto dedicated node pools by their role — ingestion, query, or control plane — for independent scaling and resource isolation. Tune memory and CPU for each role without impacting the others. See Role Isolation.
Metrics
- Metrics Cardinality Explorer
-
New unified interface for exploring metrics, labels, and their relationships. Combines metric discovery, label analysis, and cardinality investigation in a single workflow. Supports progressive filtering with promoted label filters and optional series count display for identifying high-cardinality issues. See Metrics Cardinality Explorer.
- Multi-Rollup Resolution
-
Metrics rollup tables now support multiple resolutions. Queries automatically select the appropriate rollup resolution and backfill gaps from the raw table, improving query completeness for long time ranges.
- High-Cardinality Query Improvements
-
Metrics queries with high cardinality label combinations now use less memory and complete faster. Series limits are enforced at all processing stages, preventing out-of-memory failures on high-cardinality queries.
- Dynamic Range Query Splitting
-
Large range queries automatically split based on series count, avoiding series limit errors on high-cardinality metrics.
SLO
- Improved SLO Accuracy
-
SLO metrics are now computed at query time from raw data, improving accuracy and eliminating the need for recording rules.
- Configurable Time Windows
-
SLOs now support configurable time windows (7-day and 30-day). The SLO list page shows a new Time column, and the detail page automatically scales lookback windows and graph step sizes to match the configured period.
APM
- Query Stats for Traces
-
Trace queries now show documents scanned and total documents during execution, matching the existing logs query stats experience.
- Traces Streaming
-
Traces, trace errors, and trace analytics now load progressively via streaming, showing partial results as they arrive. Long-running trace queries can be cancelled from the UI. Streaming is also supported in dashboard panels and alert evaluation views.
MCP Server
Kloudfuse now supports a Remote MCP Server that runs within the Kloudfuse stack. Unlike locally hosted MCP servers that require local installation and configuration, the Kloudfuse Remote MCP Server provides a secure, centrally managed experience with built-in authentication, query safety validation, and audit logging.
- Profiling
-
Query and compare application performance profiles via MCP for AI-assisted performance analysis. Includes tools for discovering profile types, retrieving flame graphs, querying time series, and comparing profiles across time ranges.
- Query Safety Mode
-
PromQL and LogQL queries are validated before execution in safe mode, rejecting bare metric selectors without label filters, excessive lookback/step ratios, and queries that would produce too many data points.
- Horizontal Scaling
-
MCP server can be scaled horizontally behind a load balancer for higher availability.
- Audit Logging
-
All MCP tool invocations and outbound API calls are logged with duration and error information for compliance and troubleshooting.
Security and Infrastructure
- Pod Security Configuration
-
All services now run as non-root users by default and support configurable service accounts and security context via Helm values for tighter security posture.
- Audit Log Timestamps
-
Audit log entries now use the time the event occurred rather than ingestion time, ensuring accurate timelines even when there is ingestion delay.
- Faster Server Restarts
-
Pinot servers now preload all segments before becoming available, reducing restart time and eliminating excessive coordination overhead during rolling upgrades.
Alerts
- Alert Query Escaping Fix
-
Fixed double-escaping of alert queries that caused evaluation failures for alerts containing special characters. Existing alerts are automatically normalized when loaded.
- Multi-Contact Point Notification Policies
-
Alerts now support managed notification policies with multiple contact points. Configure grouped notification routing to send alerts to different contact points based on alert labels and routing rules.
- Alert Management
-
Alerts created from the Kloudfuse UI can no longer be modified from Grafana, preventing unintended changes to alert configurations managed through Kloudfuse.
RUM
- Application-Specific Custom Facets
-
Added support for custom facets scoped to specific applications, allowing per-application facet configuration.
- Custom Metrics
-
Added support for custom metrics in RUM for tracking web vitals such as LCP, FCP, and INP, with time series aggregation, filtering, and event detail views.
- Page Improvements
-
Standardized the main RUM page layout with consistent header, sidebar, and tab positioning matching the rest of the platform. Tabs now use responsive overflow layout and event type filters are integrated into the header bar. This change applies to the main RUM page only.
Logs
- Facet Name Filtering
-
Added contains pattern filtering for facet names in log search, making it easier to find relevant facets in large schemas.
- Save Query Validation
-
Save queries now validate that an aggregation operator is present, returning a clear error message for invalid queries instead of producing unexpected results.
- Scheduled Views — Historical Data Support
-
Scheduled views now support processing historical data. Specify a start time when creating a view to backfill data from a past point in time. Views that fall behind automatically catch up, processing accumulated data in bounded iterations until current. See Scheduled views.
- Scheduled Views — Status Monitoring
-
Scheduled view status now shows evaluation time, next evaluation time, and lag for monitoring health.
- Log Level Detection
-
Improved log level detection for OTLP-sourced logs. Logs that carry the level in agent-processed metadata are now correctly classified instead of falling back to message body parsing.
- Timestamp Validation
-
Timestamp bounds checking is now applied to all log sources regardless of the timestamp mode. Previously, out-of-bounds timestamps from agent or ingestion sources could pass through without validation.
3.5.2-p2
February 6, 2026
This patch release includes bug fixes and improvements for dashboards, FuseQL query handling, hydration, log ingestion, and metrics processing.
To upgrade to this release, see Upgrade Kloudfuse.
Dashboards
- Hydration Job List Display
-
Fixed issue where hydration job list would appear empty when
archiveAddTagscontains invalid JSON. - Panel Data Loading
-
Panels now correctly use their configured datasource and target settings for more reliable data loading.
- FuseQL Validation
-
Added validation when switching between query modes in dashboard edit to prevent invalid query configurations.
- Data Table Styling
-
Removed unnecessary borders in dashboard data table panels for cleaner visualization.
- WebSocket Loading State
-
Fixed an issue where the loading state was not cleared after a query completed via WebSocket, causing the UI to appear stuck in a loading state.
FuseQL
- Parse Multi Support
-
Introduced new
parse multifunctionality for parsing multiple patterns from log data. - Parse Multi Anchoring
-
Added anchored pattern matching to parse multi for more precise log parsing.
- Parse Multi Nodrop Option
-
Parse multi now supports
nodropoption to preserve unmatched fields. - Lookup As Optional
-
Lookup operations no longer require the 'as' clause, improving query simplicity.
- Lookup with Alias Fields
-
Fixed bug where lookup operations with aliased fields would produce incorrect results.
- Saved View Expiry
-
Corrected configuration handling for saved view expiration settings.
Log Ingestion
- Concatenated JSON Parsing
-
Fixed a regression where concatenated JSON payloads (for example,
{"log":"a"}{"log":"b"}) were only parsing the first object, silently dropping subsequent log entries. This affects fluentd-json, fluent-bit-json, Datadog, and hydration ingestion paths. - Heroku Log Format
-
Fixed a regression where Heroku syslog messages were incorrectly wrapped in JSON instead of being passed through as raw messages. Decompression error metrics for Datadog payloads were also restored.
3.5.2-p1
January 25, 2026
This patch release includes bug fixes and improvements for dashboards, alerts, LogQL query handling, metrics rollup, SLO management, and lookup tables.
See the issues we fixed in this release.
To upgrade to this release, see Upgrade Kloudfuse, and Upgrade to 3.5.2-p1.
Dashboards
- Transpose Logs Table
-
Fixed an issue where transposed log tables were not rendering correctly in dashboard panels.
- LogQL Panel Support
-
Fixed an issue where LogQL-based panels were not working correctly in dashboard views.
- RUM Template Variables
-
Fixed an issue where dashboard template variables were not properly filtering RUM data in dashboard panels.
- Dashboard List Limit
-
Increased dashboard list limit from 1000 to 5000, allowing users to view and manage larger dashboard collections.
- Sparkline Visualization
-
Fixed an issue where sparkline charts were not showing all bars when a custom timeslice differs from the UI bucket size.
LogQL
- LogQL Regressions
-
Fixed regressions in LogQL implementation that affected query execution and result accuracy.
- Compare Operator
-
Fixed a panic when using compare operators in streaming queries.
- Compare Timeshift
-
Fixed column naming for minute-duration timeshifts in compare queries.
- Streaming Aggregation
-
Fixed issues with NaN values and format function type mismatches in streaming aggregations.
- Compose Operator
-
Fixed issues with compose operator returning incomplete results and not respecting subquery limits.
3.5.2
January 2026
This release introduces FuseQL subquery support, improved logs and alerts performance, enhanced RBAC with folder-level permissions, shortened URLs for bookmarking, container image signing with OIDC support, and numerous dashboard and alert improvements.
Additionally, we fixed a number of issues. See the bugs we fixed in this release.
To upgrade to this release, see Upgrade Kloudfuse, and Upgrade to 3.5.2.
FuseQL
- Subquery Operator
-
Added the
subqueryoperator for executing nested queries within FuseQL. This enables complex analytical patterns where results from one query can be used as input for another, supporting use cases like finding logs from hosts with specific error patterns. - Transpose with Line/Column Graphs
-
Enhanced the
transposeoperator to support line and column graph visualizations in dashboards. Create graphical representations of transposed data for better trend analysis.
Logs
- Logs Performance Improvements
-
Improved performance for logs analytics, timeline, fingerprint, and download operations with real-time progressive loading for large result sets.
- Query Progress Reporting
-
Added real-time query progress display on logs tabs showing documents scanned and total documents. This provides visibility into query execution progress for long-running searches.
- Cancel Running Queries
-
Added ability to cancel long-running streaming queries from logs, metrics, dashboards, and alerts screens. Users can now abort queries that are taking too long without refreshing the page.
- Scheduled View Download
-
Added download button for Scheduled views results, enabling export of scheduled search data for offline analysis.
Access Control
- Folder-Level Permissions
-
Enhanced RBAC with Folder Permissions for Kloudfuse objects. Assign view or edit permissions at the folder level, with permissions automatically inherited by objects within folders.
- Duplicate Folder Prevention
-
Prevents creation of duplicate folder names during create, edit, and move operations for better organization.
- Enhanced Audit Logging
-
Improved audit logging to correctly trigger on folder create, update, and delete operations. Better visibility into permission and folder changes.
Alerts
- Alerts Performance Improvements
-
Faster and more responsive rendering for log-based alert evaluation, especially for complex alert queries.
- FuseQL Alert Enforcement
-
Enforced FuseQL usage for alert queries with proper validation and error messaging when queries cannot be converted to query builder format.
- Pending Alert Silence Display
-
Added display of pending alert silences in the Kloudfuse UI for better visibility into upcoming silence windows.
Security
- Container Image Signing
-
Kloudfuse container images and Helm charts are now signed. Customers can verify image integrity before deployment.
- OIDC Token for Image Pull
-
Added support for OIDC federation for external partners to securely pull images from AWS ECR without long-lived credentials. Partners can configure their CI/CD systems to use OIDC tokens for image authentication.
3.5.1-p2
December 17, 2025
This patch release includes performance improvements for queries with regex-based label filters, metrics ingestion improvements, and bug fixes for dashboards, logs, and RUM.
To upgrade to this release, see Upgrade Kloudfuse.
Fixed Issues
- Query Mode Switching
-
Fixed an issue where switching between advanced search and query builder modes did not work correctly in some cases.
- Template Values in Logs
-
Fixed an issue where changing template variable values did not properly refresh log data in dashboard panels.
- Logs Analytics Table
-
Fixed an issue where the logs analytics table would get cut off on smaller screens. The table now includes horizontal scrolling for tables with many columns.
- RUM Multi-line Regex
-
Fixed an issue where regex matching in RUM queries did not work correctly for multi-line string values.
- Control Plane Dashboard
-
Fixed the Pinot ingestion rate calculation in the control plane dashboard.
3.5.1-p1
December 13, 2025
This patch release includes significant query performance improvements for regex-based label filtering, UI fixes for FuseQL and Alerts, improved logs download performance, and support for multiple GCP project IDs in Stackdriver metrics collection.
See the issues we fixed in this release.
To upgrade to this release, see Upgrade Kloudfuse, and Upgrade to 3.5.1 p1.
Performance
- Regex Alternation Query Performance
-
Significantly improved query performance for label filters when using regex alternation across Metrics, Logs, and APM. Queries with patterns like
{service_name=~"frontend|backend|api"}or{namespace=~"prod|staging"}now execute orders of magnitude faster. This optimization applies to all queries that use regex alternation (|) for matching multiple label values.
3.5.1
December 1, 2025
This is a maintenance release with performance optimizations for metrics rollups, new FuseQL operators, enhanced Alerts management, and improvements to AWS metrics collection.
Additionally, we fixed a number of issues. See the bugs we fixed in this release.
To upgrade to this release, see Upgrade Kloudfuse, and Upgrade to 3.5.1. No additional pre-upgrade or post-upgrade steps are required for this release.
Metrics
- Rollup Table Optimization
-
Improved query performance by automatically using rollup tables for time aggregations when the lookback period is greater than or equal to the rollup interval. This optimization reduces query latency for long-range queries without requiring any configuration changes.
- Series Limit Enforcement
-
Enabled series limit enforcement by default to protect system stability. Queries without space aggregation are limited to 5,000 series, while queries with aggregation are limited to 20,000 series (prior to aggregation). These limits are configurable via the kfuse chart values.yaml.
Infrastructure Monitoring
- AWS ECS Metrics Caching
-
Fixed nested resource label caching for namespaces like AWS/ECS. Metrics for ECS services and tasks now correctly inherit and display parent resource labels, improving the accuracy of infrastructure monitoring dashboards.
- AWS RDS Cluster Metrics
-
Added cluster-level metrics scraping for Aurora DB clusters. This enhancement provides visibility into Aurora cluster-wide performance metrics in addition to individual instance metrics.
FuseQL
- Compare Operator
-
Added the
compareoperator for analyzing data across different time periods. Compare current metrics against historical baselines to identify trends, anomalies, and performance changes over time. - Transpose Operator Improvements
-
Enhanced the
transposeoperator to support multiple aggregate columns, enabling more complex data transformations in a single query. - Nested Functions in If Operator
-
The
ifoperator now supports nested function calls, allowing more complex conditional logic in FuseQL queries. - Group By on Array Columns
-
Added support for group by operations on array-type columns, enabling aggregation across multi-valued attributes.
Logs Search
- FuseQL Contextual Autocomplete
-
Improved autocomplete suggestions that respect previous filters and query context. The code editor now provides intelligent suggestions based on the current query structure, including function autocomplete for FuseQL and PromQL.
- Table Display Improvements
-
Fixed log table height issues and table cutoff at the bottom of the screen. Improved search bar styling and overall logs screen layout for better usability.
APM
- High Cardinality Facets for Traces
-
Added support for high cardinality facets in trace analysis with autocomplete, group by, and aggregation capabilities. This enables efficient exploration of trace attributes with many unique values without impacting query performance.
This feature requires explicit enablement in the kfuse chart values.yaml configuration. Contact Kloudfuse support to enable high cardinality facets for your deployment.
Alerts
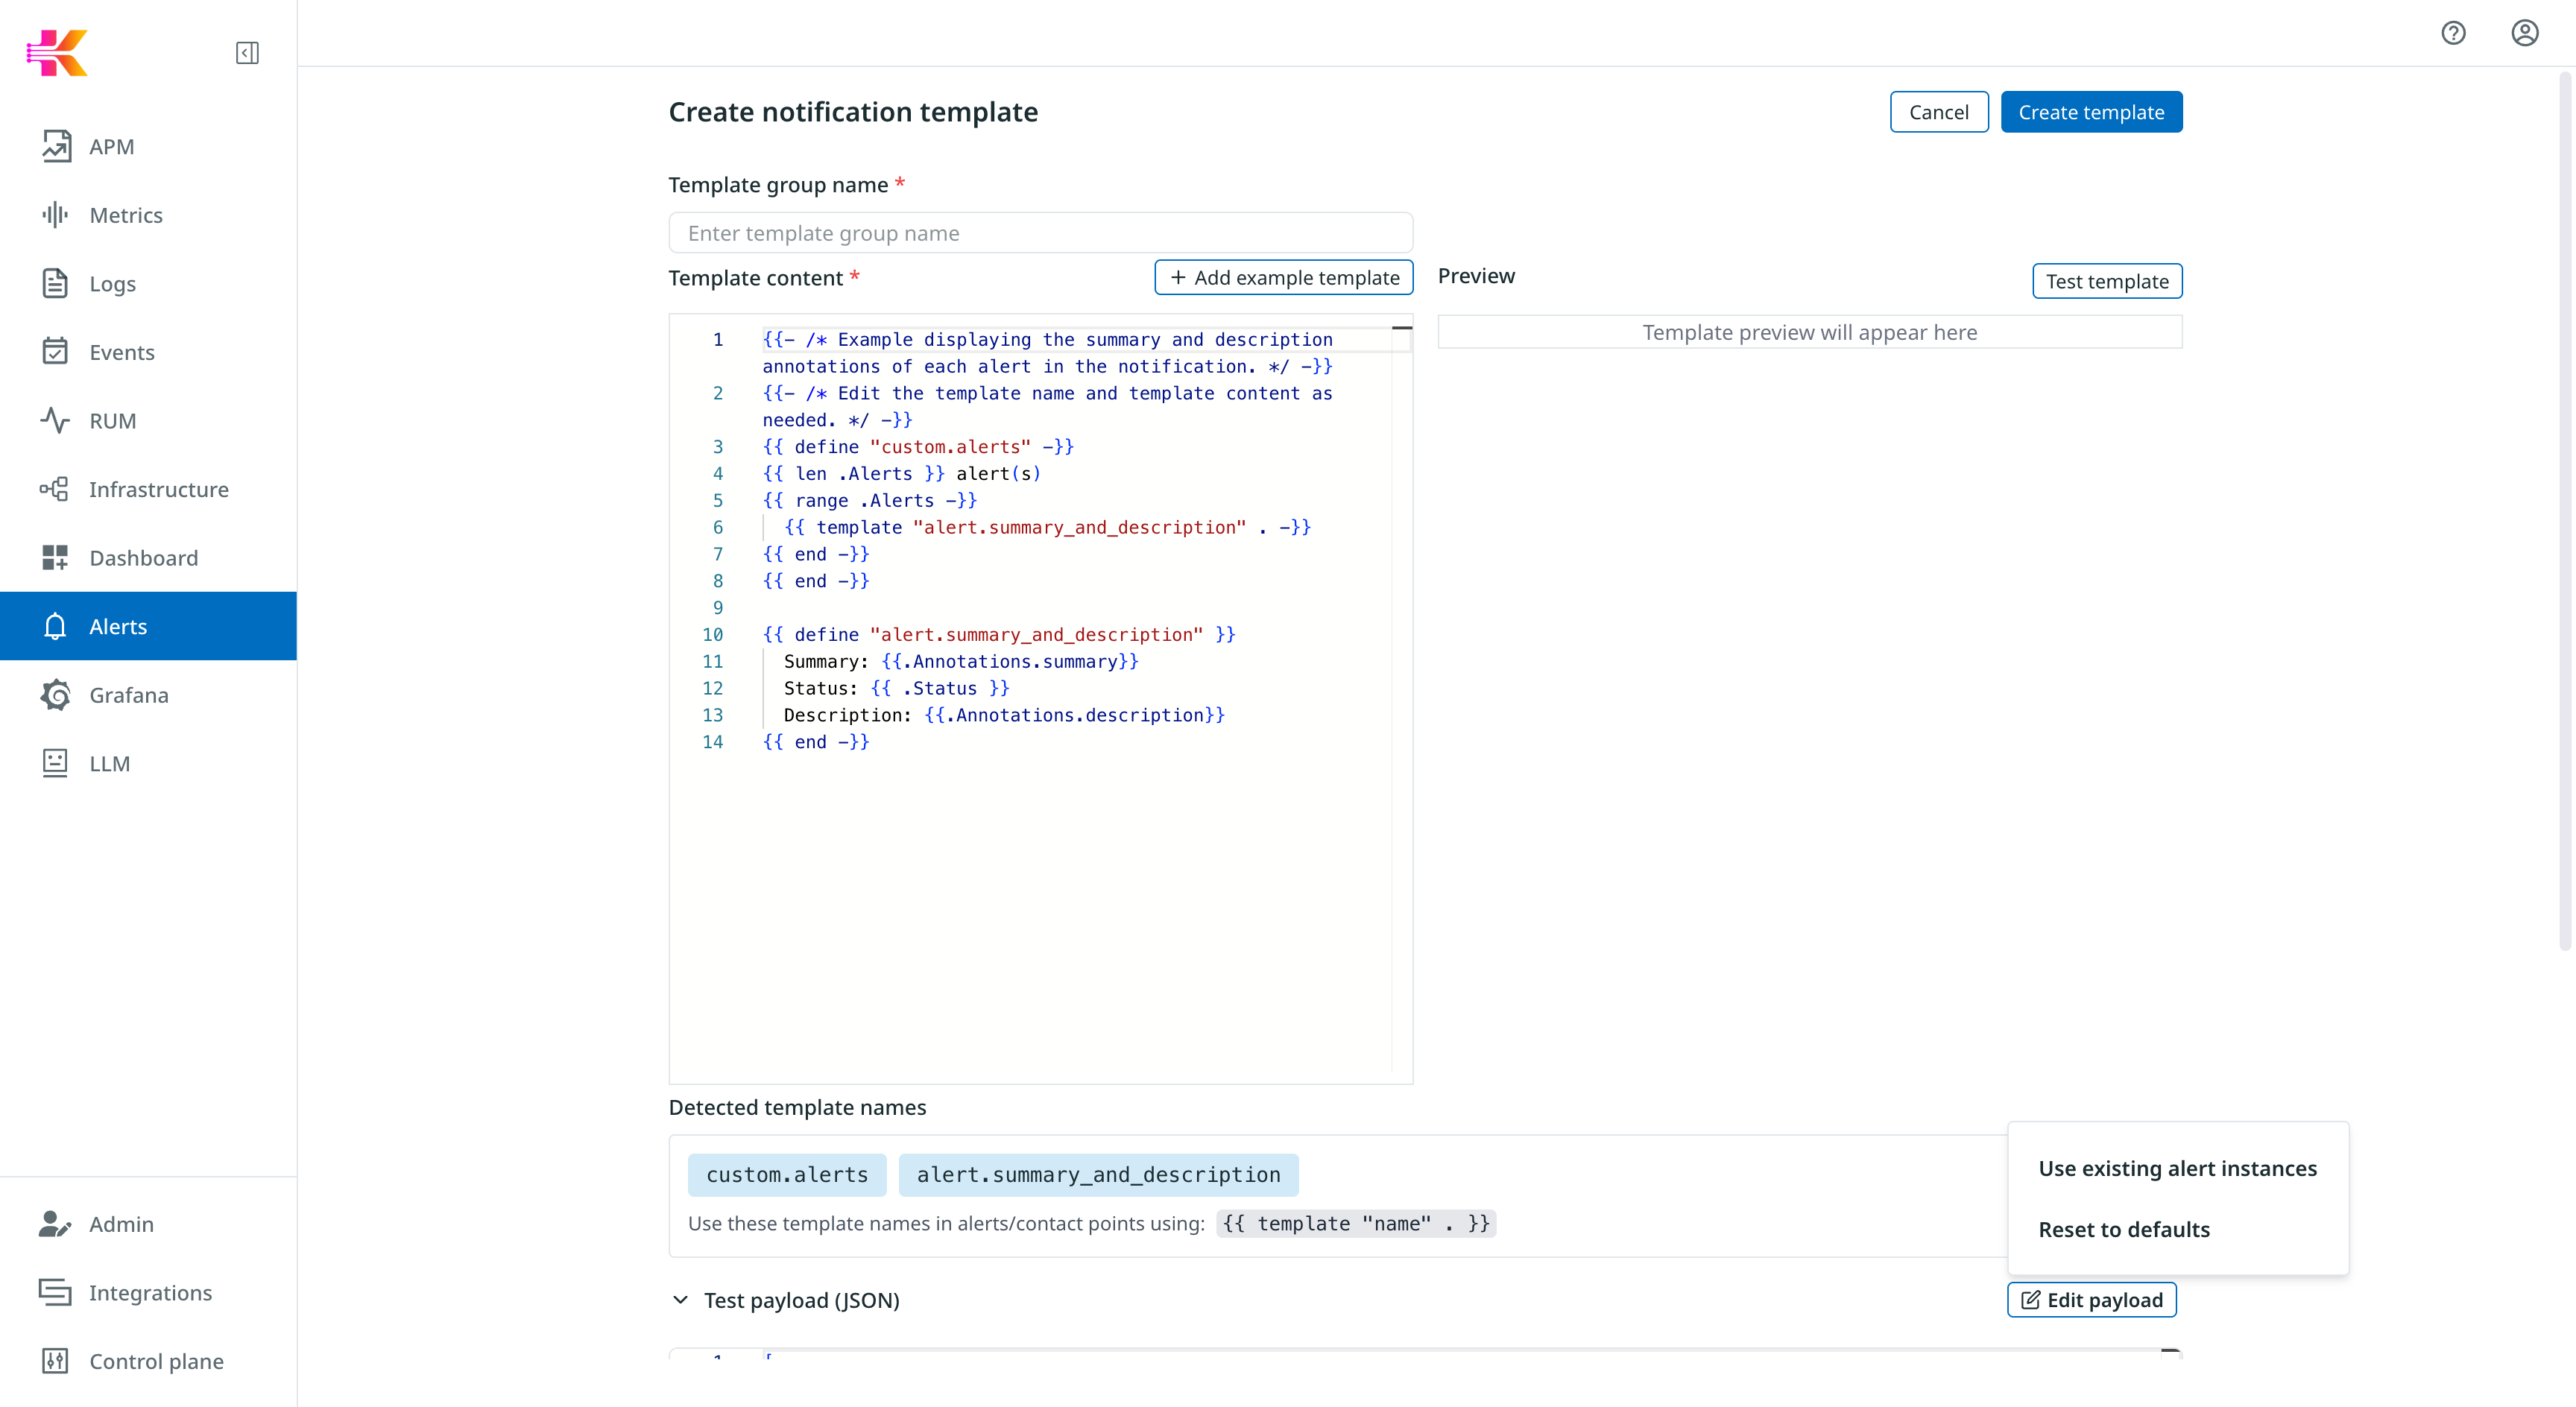
- Notification Template Payload from Active Alerts
-
When editing notification templates, you can now load payload data directly from active alerts. This makes it easier to test and preview notification templates with real alert data without manually constructing test payloads.
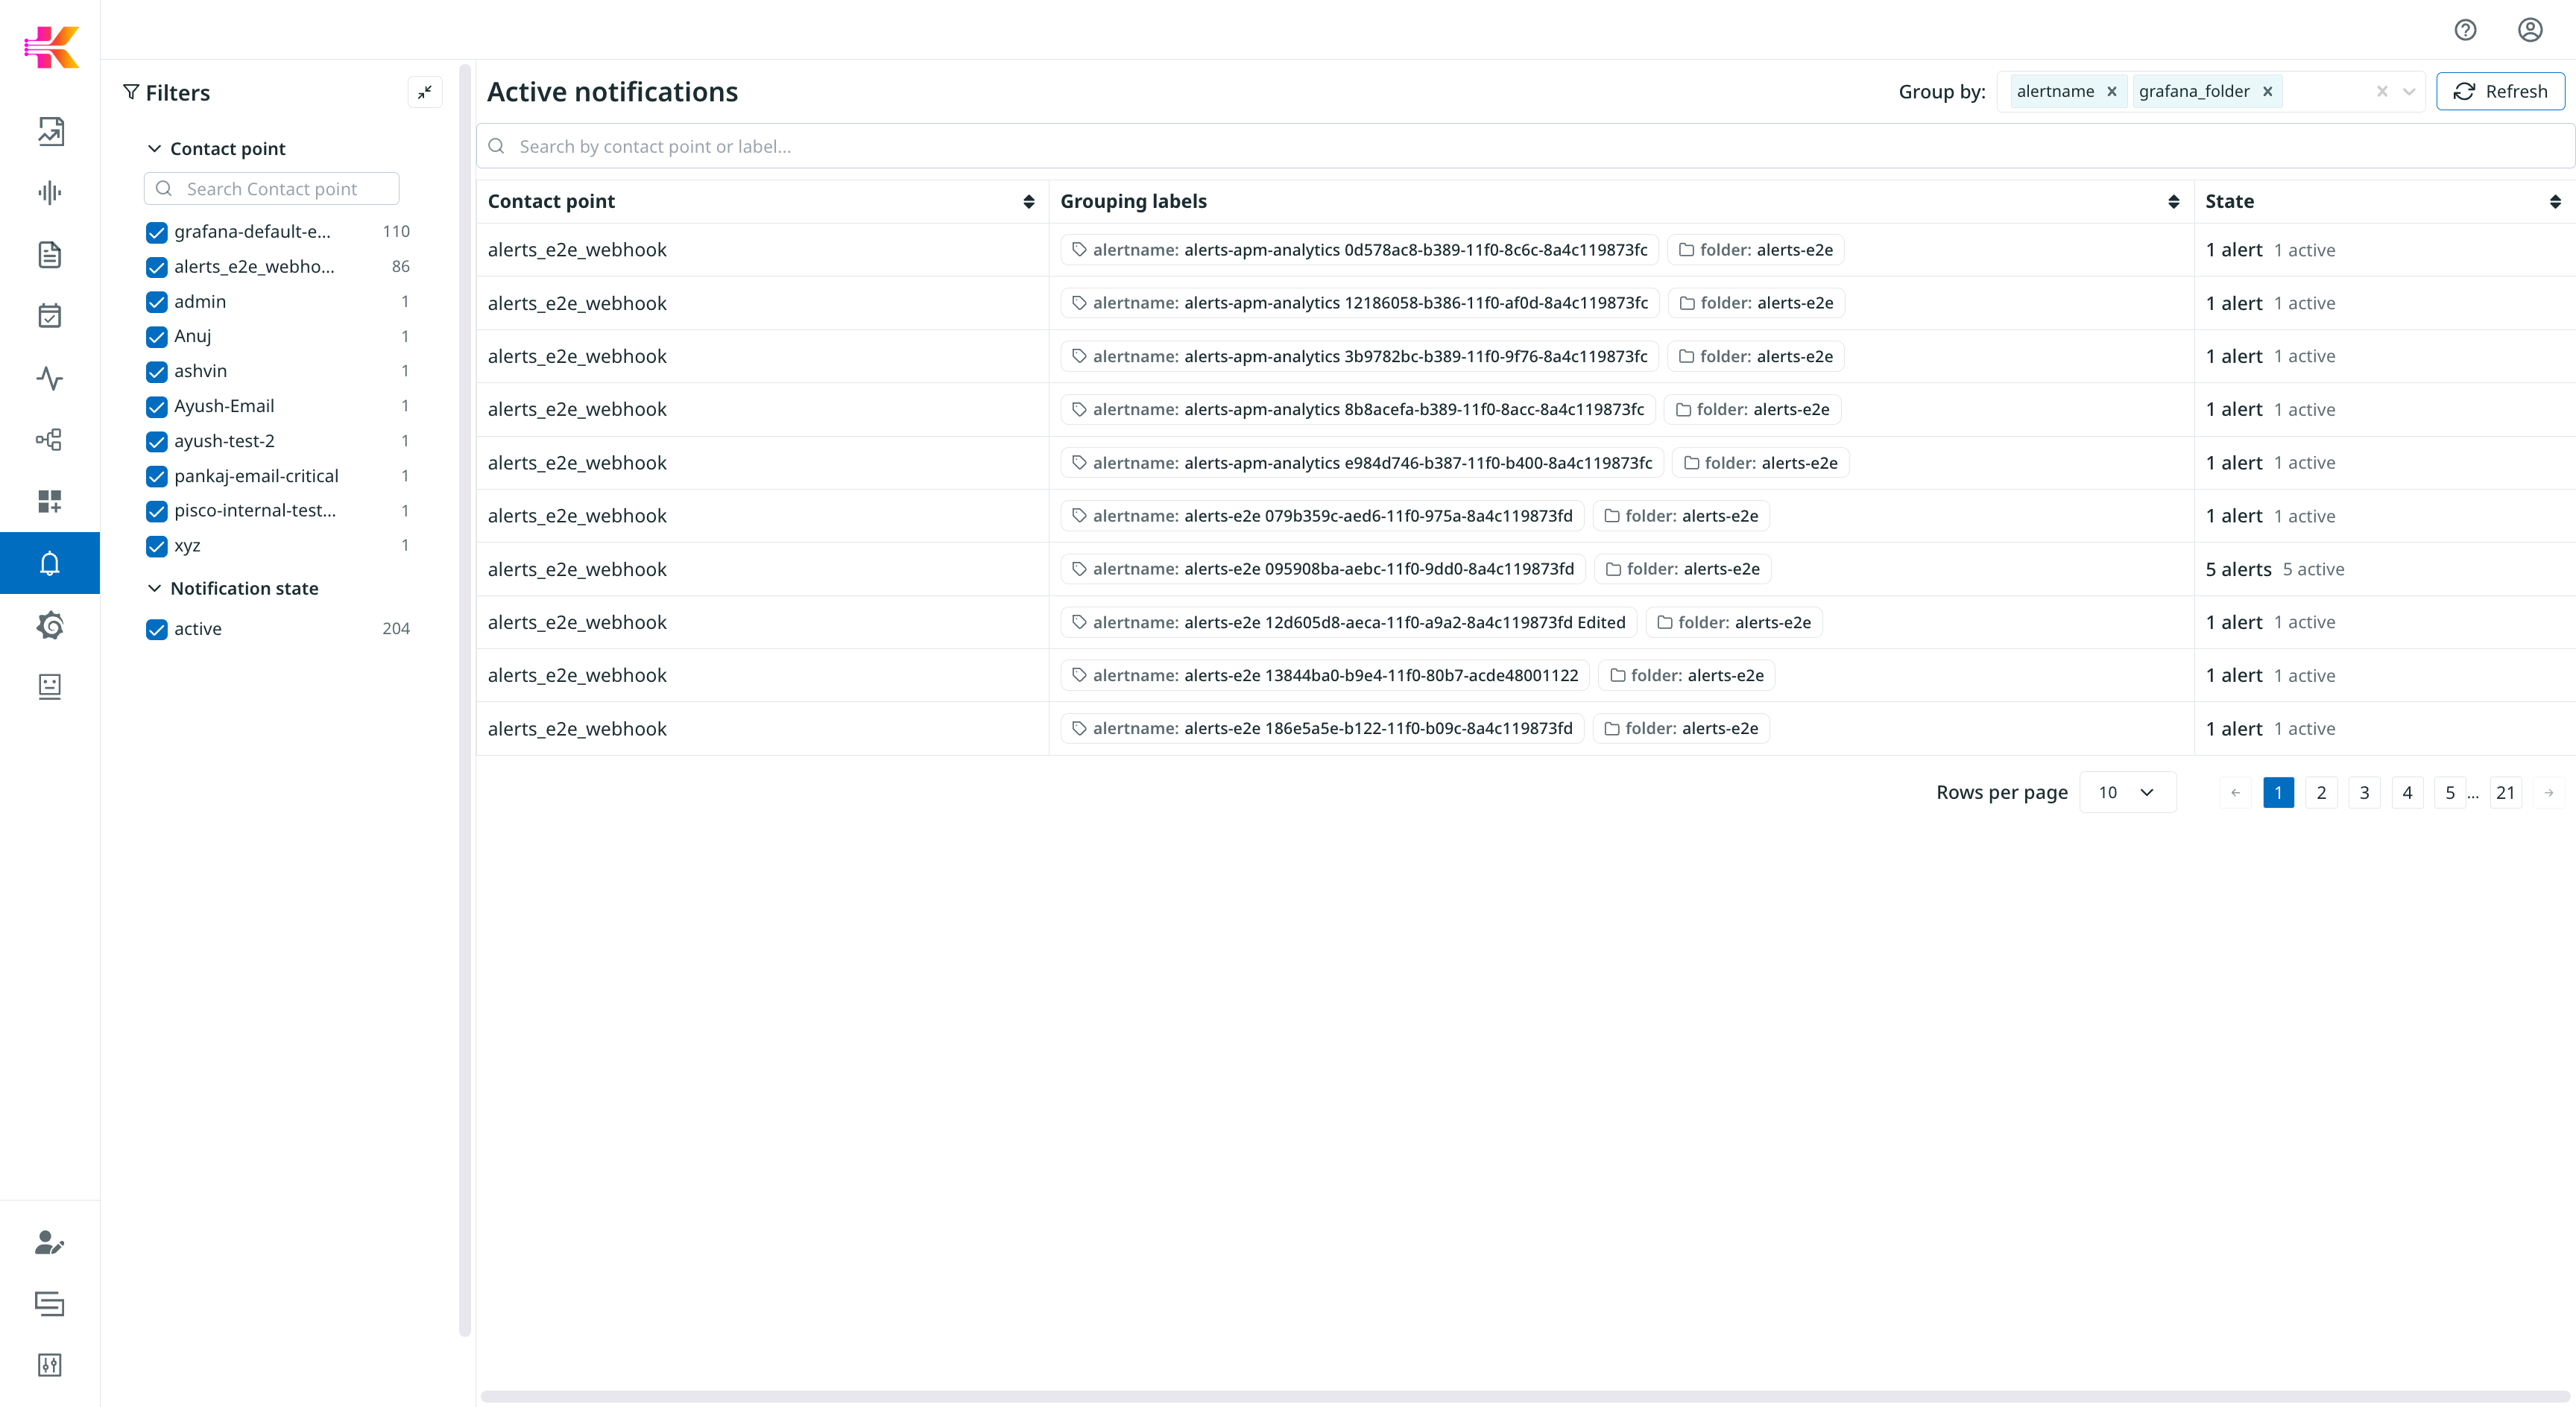
- Active Notifications Page
-
New dedicated page for viewing active alert notifications. Monitor which notifications are currently being sent and track notification delivery status in real-time.
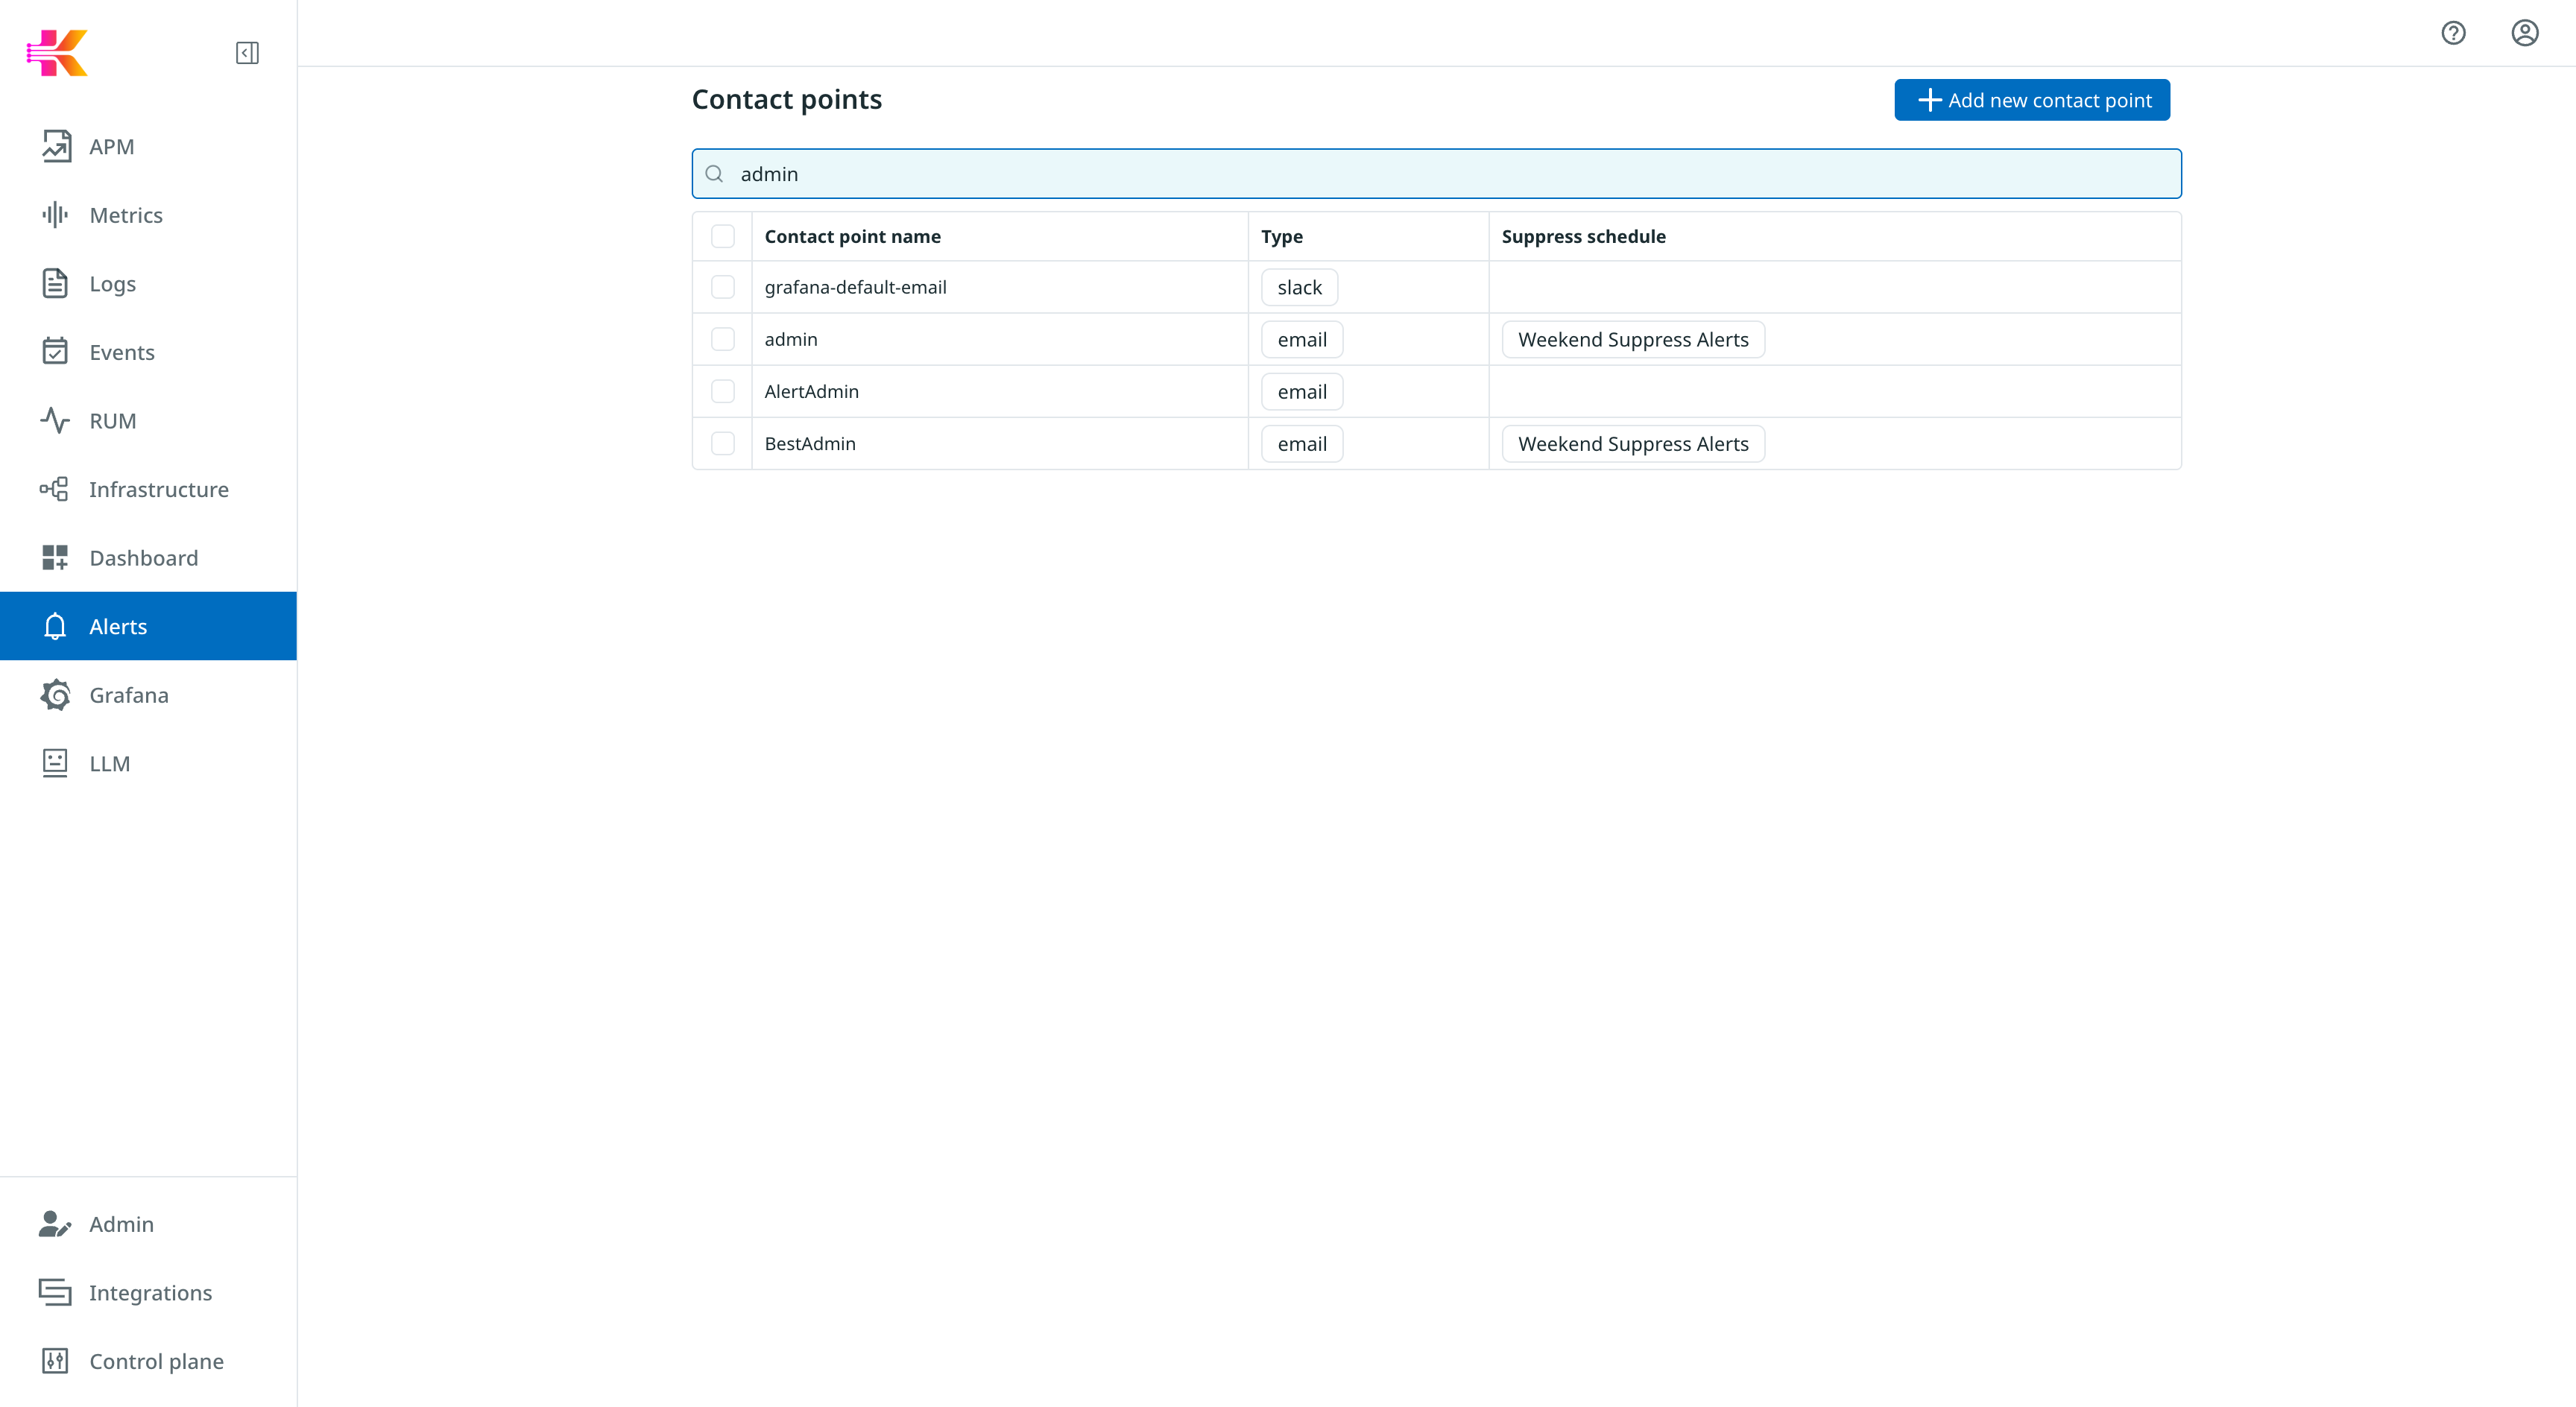
- Contact Points Search
-
Added search functionality to the Contact Points page, making it easier to find specific contact points in large configurations.
- Alert Label Filters in Events Panel
-
Added label filter support in the Events panel on the Alert page. Filter alert events by specific label values to focus on relevant alert instances and reduce noise when investigating alert patterns.
MCP Server
- RUM Tools
-
Added Real User Monitoring (RUM) tools to the Kloudfuse MCP Server, enabling AI-assisted analysis of frontend performance, user sessions, and browser metrics.
- APM Breakdown Tools
-
Added APM execution breakdown tools to the MCP Server, providing AI-assisted analysis of service execution time and downstream dependency contributions.
3.5.0
November 10, 2025
This is a major release introducing custom metrics SLOs, RUM custom facets, MCP server for AI observability, and comprehensive alerts enhancements.
Additionally, we fixed a number of issues. See the bugs we fixed in this release.
To upgrade to this release, see Upgrade Kloudfuse, and Upgrade to 3.5.0. No additional pre-upgrade or post-upgrade steps are required for this release.
Service Level Objectives (SLO)
- Custom Metrics SLO
-
Create Service Level Objectives using custom PromQL queries, not just pre-defined APM metrics. Define custom numerator and denominator queries for precise SLO calculations tailored to your specific requirements.
Key features:
-
Custom PromQL editor for numerator and denominator queries
-
Support for editing custom SLOs
-
Historical data visualization
-
Full integration with alerts and contact points
This feature enables advanced SLO scenarios such as calculating success rates from arbitrary metrics, defining custom service health indicators, and monitoring business-specific KPIs.
See Create a Custom SLO for details.
-
Real User Monitoring (RUM)
- Custom Facets
-
Promote custom attributes to facets in RUM for enhanced filtering and analytics. Create custom facets from
usrandcontextattributes to organize and analyze your RUM data according to your application’s specific needs.Key features:
-
"Promote to Facet" button on eligible string-valued attributes in RUM Event Detail pages
-
Custom facets management UI with friendly names
-
Dedicated "Custom Facets" group in sidebar for easy access
-
Full support in RUM Analytics for groupBy and filter operations
-
Create, edit, and delete custom facets through management interface
System fields like
usr.id,usr.name,usr.email, andcontext.kf_session_start_msare excluded from promotion to maintain data integrity.See RUM Custom Facets for details.
-
MCP Server
- Model Context Protocol Server
-
Provides AI agent access to Kloudfuse observability data through the Model Context Protocol (MCP) server. Enable AI-powered analysis, troubleshooting, and insights across your entire observability stack.
Available tools:
-
Prometheus: Metric queries, label discovery, and semantic search
-
APM: Service discovery, tracing, dependency mapping, and span details
-
Alerts: Alert management, history retrieval, and configuration
-
Traces: Trace search, filtering, and detailed analysis
-
Events: Event retrieval with filtering and facet discovery
-
Kubernetes: Entity queries across pods, nodes, clusters, and workloads
-
Logs: Log search with FuseQL and label discovery
-
Loki: LogQL queries and label exploration
The MCP server enables natural language queries, automated root cause analysis, intelligent alerting workflows, and AI-assisted troubleshooting across all telemetry types.
See Kloudfuse MCP Server for details.
-
Alerts
- Alert History Tab
-
New History tab displays a comprehensive state timeline for each alert with dropdown filters to narrow history by specific label values. Inspect only the events you care about and track alert state changes over time.
- Alert Versions
-
Compare two alert revisions side-by-side and restore older versions. Track changes to alert definitions over time and easily revert to previous configurations when needed.
- Enhanced Silencing Controls
-
Each alert instance row clearly displays whether it’s silenced. Mute and unmute buttons use Grafana’s matcher logic to precisely target the exact labels you’re viewing, ensuring suppression rules apply only to intended instances.
- Form Validation and Auto-tuning
-
Creating or editing alerts now prompts for evaluation duration ("for") and execution frequency ("every") with validation for positive time strings. The reducer automatically adjusts based on above/below threshold selection, and deleted annotations no longer reappear on save.
- UI Improvements
-
Alert tags in the alert list table now support expand/collapse functionality for better space utilization and readability.
- Performance Fixes
-
Fixed APM alert editing performance issue that was causing hundreds of queries to be issued. Editing APM alerts is now significantly faster and more efficient.
- Contact Point Workflow
-
Contact point creation now opens in a new tab (instead of modal) with a refresh button to update the contact point selector without losing other form inputs.
- Alert Creation Improvements
-
-
Fixed trace alert filter reset issues - filters are now preserved correctly when navigating to alert creation
-
Fixed anomaly algorithm selection not being carried over when creating alerts from metrics explorer with anomaly detection
-
Security
- Security Improvements
-
Enhanced authentication and session management with improvements to oauth2-proxy and user management service. Includes fixes for session handling and rate limiting enhancements.
-
Implemented rate limiting on OAuth2 sign-in to prevent brute force attacks
-
Addressed session replay vulnerability where stateless cookies could not be invalidated on logout
See Kloudfuse Local Login for details on configuring login security features.
-
Additional Improvements
- Metrics Explorer
-
-
Better handling of different step sizes across multiple queries
-
Fixed aggregation application logic
-
Support for
$__rate_intervaltoken in PromQL queries -
Improved function parameter preservation when creating alerts
-
Native histogram support with proper function handling
-
- APM
-
-
Fixed trace download infinite loop issue
-
Fixed error group table display showing incorrect occurrence counts
-
Improved custom label selection handling in service detail views
-
- Dashboards
-
-
Fixed text panel creation workflow
-
Improved tag handling in integration dashboard imports
-
Better template variable management
-
Dashboard import functionality on dashboard list page
-
Fixed large table performance issues in dashboard panels
-
Template variables from FuseQL queries now supported
-
Added disk usage tracking for hydration
-
- Visualization
-
-
Fixed chart dimension shifting when toggling between combined and non-combined queries
-
Resolved analytics visualization rendering issues
-
Improved legend display and series counting accuracy
-
- FuseQL
-
-
Fixed query issues with facet as column
-
Improved formula operations handling
-
Fixed issues with operators when used on _timeslice column
-
Fixed scheduled view query results display
-
3.4.4-p1
October 31, 2025
This release focuses on infrastructure improvements with FIPS-140-3 compliance and hardening, Heroku log ingestion support, enhanced PromQL capabilities, and security fixes. This patch release includes a refined Kafka-Kraft migration process.
To upgrade to this release, see Upgrade Kloudfuse, and Upgrade to 3.4.4-p1.
Infrastructure
- FIPS-140-3 compliance and hardening
-
Migrated all external dependencies from Bitnami and third-party repositories to internal registries for FIPS-140-3 compliance and improved security posture.
To enable FIPS mode, set the following in your Helm values configuration:
global:
  fips:
    enabled: true
yaml - Kafka 4.1 upgrade
-
Kafka has been upgraded to version 4.1 with KRaft mode support, eliminating the dependency on ZooKeeper for metadata management.
This upgrade requires a multi-phase migration process with improved ingester-first migration strategy. See the upgrade documentation for detailed migration steps.
Fixed Issues
- Log splitting functionality
-
Fixed critical issue with log split queries by migrating to KfLogSplit implementation.
- Lookup table size restrictions
-
Removed maximum columns and rows restrictions for lookup tables, allowing tables of any size.
- Security vulnerabilities
-
Fixed CVE vulnerabilities across UI, query-service, and logs-parser components.
3.4.3
October 10, 2025
This release includes major enhancements to metrics capabilities with native histogram support, expanded cloud integrations for AWS and GCP, data management improvements with scrubbing support for Events and RUM, and numerous improvements to dashboards, alerts, and workflows across the platform.
To upgrade to this release, see Upgrade Kloudfuse, and Upgrade to 3.4.3.
Metrics
- Native histogram support
-
Kloudfuse now supports Prometheus native histograms and OTLP exponential histograms. This enables more accurate representation of metric distributions with dynamic bucket boundaries and improved storage efficiency.
New histogram functions include
histogram_avg(),histogram_count(),histogram_fraction(),histogram_sum(),histogram_stddev(), andhistogram_stdvar().
Alerts and Dashboards
- Bulk alerts import/export
-
You can now import and export multiple alerts in bulk, streamlining migration and backup workflows.
- Bulk dashboard import/export via zip
-
Dashboards can now be imported and exported in bulk using zip files for easier backup and migration.
- Alert details sidebar
-
Alert lists now open a sidebar when viewing details instead of refreshing the entire page, improving navigation and workflow efficiency.
- Template variable support for traces and events
-
Added template variable support for trace and events analytics dashboards, enabling dynamic filtering and parameterization.
Logs and FuseQL
- Lookup table improvements
-
Lookup table creation workflow now supports empty CSV files with headers only and composite primary keys. Update operations properly handle duplicate entries.
- Save query on table tab
-
Save query option is now available on all subtabs in FuseQL except fingerprints. Export option renamed to "Add to Dashboard" for clarity.
- Log message and metadata filtering
-
Added reserved field names for filtering on log message content and metadata in FuseQL queries. Reference the Miscellaneous operators
Cloud Integrations
- AWS CloudFront enrichment
-
Added support for AWS CloudFront metrics enrichment and default metric aggregations. CloudFront metrics are now available with proper aggregation types as defined by AWS CloudWatch.
- GCP Stackdriver metrics and enrichment
-
Added support for GCP Stackdriver (Google Cloud Monitoring) metrics ingestion and enrichment. Monitor Google Cloud resources with native metric collection and contextual enrichment.
Data Management
- Scrubbing support for Events and RUM
-
Data scrubbing now supports Events and RUM data streams. You can preview, filter, and delete Events and RUM data for compliance and data retention requirements.
See Scrub Jobs
Fixed Issues
- Dashboard stat panels
-
Fixed issues where stat panels returned "No Data" for valid queries and setting decimal values broke panel rendering.
- FuseQL translation
-
Fixed inconsistent behavior when toggling between builder and advanced modes. Key exists operator and other filters now translate correctly between modes.
- Logs timeseries rendering
-
Improved timeseries rendering performance to reduce excessive re-rendering on user interactions.
- Scrubber improvements
-
Fixed scrubber minion stalling issue and improved overall stability.
- Lookup table save feedback
-
UI now provides visual confirmation when lookup tables are successfully saved.
3.4.2-p1
September 18, 2025
This is a patch release that includes new features for alerts management and fixes several UI issues across the platform.
To upgrade to this release, see Upgrade Kloudfuse, and Upgrade to 3.4.2-p1.
Fixed Issues
- Bulk dashboards import/export
-
Fixed UI bugs and made improvements to dashboard import/export workflows.
- Integration
-
Fixed a bug where UI showed blank integration pages.
- Infrastructure
-
Fixed bugs on infrastructure UI that caused some information cells to be blank.
- Control Plane
-
Fixed a bug on Logs dashboard in Control Plane.
3.4.2
September 5, 2025
This is a major release. We focused on improving alerts, dashboards, query capabilities, and system observability. We also added support for folders and nested folders, self-ingesting audit logs, and expanded infrastructure integrations.
Additionally, we fixed a number of issues. See the bugs we fixed in this release.
To upgrade to this release, see Upgrade Kloudfuse, and Upgrade to 3.4.2.
Platform
- Navigation layout update
-
The main navigation has moved from the top bar to a left-hand panel. This update provides more workspace for dashboards and a consistent, modern navigation experience. All modules — such as APM, Metrics, Logs, Events, RUM, Infrastructure, Dashboards, and Alerts — are now accessible from the left sidebar.

Alerts and Dashboards
- Bulk dashboard import/export
-
You can now import and export multiple dashboards in one action, simplifying migration and backup workflows.
- Drag-and-drop for dashboard rows
-
Dashboards now support dragging and dropping row panels for easier layout customization.
- Stats panel editing
-
Stats panels can now be edited in dashboards, improving flexibility.
- Create alerts from APM service details
-
Alerts can now be created directly from APM service details panels.
- Individual alert suppression
-
Suppress noisy alerts individually without disabling entire policies.
- Chart style selection
-
You can now choose chart styles in dashboards for more tailored visualization.
- Notification policy management
-
Create, edit, and delete notification policies directly in the UI.
See Dashboards and Alerts.
FuseQL
catandsaveoperators-
FuseQL now supports the
catandsaveoperators, enabling more flexible data workflows.See:
lookupContainssupport-
Query lookups are now more powerful with
lookupContains.See Lookup operators
Folders
- Folder support for Kloudfuse objects
-
Dashboards, alerts, and other Kloudfuse objects can now be organized into folders. This improves navigation, access control, and sharing in large environments.
- Nested folder support
-
Folders now support hierarchical nesting. You can mirror complex organizational structures and manage resources at multiple levels.
- RBAC folder details
-
Folder detail pages now show which alerts and dashboards are contained in the folder.
Hydration
- Hydration UI improvements
-
The Hydration UI has been redesigned for clarity and usability. You can now track progress more easily and troubleshoot issues faster when replaying or recovering data.
See Logs Hydration
Infrastructure
- Kubernetes monitoring with OTel Collector
-
Kloudfuse now supports Kubernetes infrastructure monitoring via the OpenTelemetry (OTel) collector, in addition to Datadog.
- Grafana 12 upgrade
-
We upgraded Grafana to version 12.0, ensuring compatibility and access to the latest visualization features.
- Downloadable analytics tables
-
Tables in Logs, APM, and Event Analytics now include a download option for exporting data.
3.4.1
August 13, 2025
This is a minor release. We focused on improving security, stability, and compliance.
Additionally, we fixed several issues. See the bugs we fixed in this release.
To upgrade to this release, see Upgrade Kloudfuse, and Upgrade to 3.4.1.
- FuseQL diff operator
-
Compare two time ranges (or two result sets) directly in a query to see what changed. Use
DIFF()to return only the deltas. See FuseQL. - Hydration jobs – support for Regex and filters
-
Define hydration jobs with
regex,not regex, and!=(not equal) filters to target specific records more precisely. See Use Regex and filters in hydration jobs. - Support for relabel rules for high cardinality attributes in APM ingestion
-
Apply relabel rules to high-cardinality attributes during APM ingestion to standardize names and improve control over downstream metrics and storage. See Relabel Rules.
3.4.0-p2
Aug 11, 2025
This release fixes important issues related to Datadog integration, span attribute handling, Helm validation, and label filters.
See the issues we fixed in this release.
To upgrade to this release, see Upgrade Kloudfuse, and Upgrade to 3.4.0 p2.
3.4.0
July 21, 2025
This is a major release. We primarily focused on improving our Admin and RBAC features.
Additionally, we fixed a number of issues. See the bugs we fixed in this release.
To upgrade to this release, see Upgrade Kloudfuse, and Upgrade to 3.4.0.
Admin and RBAC
- Groups are now Teams
-
We renamed Groups to Teams, removed the concept of Team Ownership (each Team has a default Admin account member), and streamlined role assignment within Teams.
See Manage Teams.
- Service Accounts
-
We added service accounts to this release. They allow applications to securely interact with other systems or APIs in the background using bearer tokens. These workflows do not require human involvement, and automate workflows.
See Service Accounts.
- Data scrubbing
-
This new powerful approach enables users to safely delete data from Metrics, Logs, and APM streams. Create a scrub job by specifying the stream type, one or more filters (label, comparison operator, and value), and the relative time interval. By matching these criteria, Kloudfuse creates a scrub job.
See Scrub Jobs.
- Policies
-
Starting with this release, you can assign RBAC policies directly to both Users and Service Accounts. This is in addition to the existing process of Users inheriting policies through their Group/Team assignment.
Installation
- Multi-AZ Support
-
You can now install Kloudfuse across multiple availability zones (AZs) for high availability (HA). If one AZ fails, Kloudfuse continues operating without disruption. This is critical for large-scale and production-grade deployments.
See HA Multi-AZ Setup.
Infrastructure
- Infrastructure Table Improvements
-
The Infrastructure view now uses infinite scroll instead of traditional pagination. This improves navigation when working with large datasets.
Additional enhancements to infrastructure include the following:
-
Grouping rows by most columns using the new group/ungroup icon in the column header
-
Multi-line rows display is cleaner, and easier to read.
-
3.3.6
June 25, 2025
We fixed several issues in this release; see bugs.
There are no special steps to successfully upgrade your Kloudfuse to this release; just follow the general instructions in Upgrade Kloudfuse.
3.3.5
June 18, 2025
We are continuing to enhance our RBAC offering.
We also used this release to address a recent Grafana vulnerability, CVE-2025-4123. We urge you to work with our CS team to upgrade Kloudfuse in the immediate future.
We fixed several issues in this release; see bugs.
There are no special steps to successfully upgrade your Kloudfuse to this release; just follow the general instructions in Upgrade Kloudfuse.
RBAC
- Group and Role synchronization
-
We are introducing automated Group Memberships and Role Synchronization with OKTA (SAML or oauth 2.0) and Google (only SAML). We do not support Google with oauth 2.0; you must perform these configurations manually.
3.3.4
June 11, 2025
We fixed a small number of issues in this release; see bugs.
There are no special steps to successfully upgrade your Kloudfuse to this release; just follow the general instructions in Upgrade Kloudfuse.
3.3.3
June 5, 2025
We fixed a small number of issues in this release; see bugs.
There are no special steps to successfully upgrade your Kloudfuse to this release; just follow the general instructions in Upgrade Kloudfuse.
3.3.2
May 30, 2025
This is a minor release to enhance our FuseQL offering.
We also fixed a small number of issues affecting the FuseQL-related screens; see bugs.
There are no special steps to successfully upgrade your Kloudfuse to this release; just follow the general instructions in Upgrade Kloudfuse.
FuseQL
- Parsing JSON Arrays
-
We added support for parsing arrays inside json log messages. See JSON Operator.
3.3.1
May 28, 2025
This release refines a number of features we introduced recently.
Additionally, we fixed a number of issues. See the bugs we fixed in this release.
To successfully upgrade your Kloudfuse to this release, follow the instructions in Upgrade Kloudfuse, and specifically in Upgrade to 3.3.1.
Audit Logs
We introduced Audit Logging in this release. For security and compliance, we log all configuration operations, including dashboard and alert operations.
Use the enable-audit-logging flag to enable/disable audit logging; it is on by default.
Infrastructure
| These improvements are in Early Adopter phase, and are not on by default. Contact our Support team to enable these changes. |
We improved the look and feel of the Infrastructure UI to make it more scalable for visualizing and managing systems of greater size and complexity. Specifically:
-
You can now sort most columns
-
You can see new organization for columns in some tables
-
You can now filter by facet, and see the facet column.
Events
- OTel Events
-
We are now supporting Kubernetes events through Open Telemetry (OTel) integration. See OTel Collector on Kubernetes.
- Events Sidebar
-
We made improvements to the sidebar, enhancing usability, adding new groupings for labels, and calling out the facets. See Events List, and Events Filters.
APM
- Query streaming
-
We improved the performance of charts by streaming the trace data, error report, and error group report. You no longer have to wait for charts that display long intervals. Kloudfuse cancels outstanding queries as you change query parameters.
- Download
-
We added the ability to download Error and Error Group reports.
FuseQL
We added the following operators in this release:
- if
-
The
iffilter operator can now evaluate math expressions. For example, if (C > 1000)`.It can also produce values that are variables, like labels, facets, or extracted. For example,
if (source="application", source, "unknown"). - where
-
The
wherefilter operator can now evaluate math expressions. For example,where (C+5 > 0). - '…'
-
Add single quotes* around the
termsfilter to process strings that contain symbols and spaces. - backshift
-
In a views table, shifts a column in a table downwards. See backshift.
- dedup
-
Removes duplicate results in a table. See dedup.
- *
-
When searching, you can now use the * (wildcard) to find a match within a logline.
Integrations
- Kubernetes Dashboards and Alerts for OTel
-
- Dashboards
-
In the Kubernetes Dashboard section, find the following new entries:
Expand to view the Kubernetes Alerts page

-
KubernetesOverview - OTel
-
KubernetesClusterOverview - OTel
-
KubernetesNodesOverview - OTel
-
KubernetesJobsAndCronJobsOverview - OTel
-
- Alerts
-
In the Kubernetes Alerts section, find the following new entries:
Expand to view the Kubernetes Alerts page

-
Kubernetes Deployment replicas lower than desired - OTel
-
Kubernetes Pods restarting - OTel
-
Kubernetes Pods failed - OTel
-
Kubernetes Pods using high CPU - OTel
-
Kubernetes Pods using high memory - OTel
-
Kubernetes statefulset replicas lower than desired - OTel
-
- Runbooks for CP alerts
-
You can now access the Runbooks for Control Panel alerts by clicking the URL on the Alert Details page.
- Grafana upgrade to 11.6
-
We upgraded the Embedded Grafana to Release 11.6.
Dashboards
- Consumption Tracking
-
We unified the information on consumption in the Consumption Tracking dashboard. You can remove the following dashboards, if present: Consumption Overview, Consumption Overview v2, and Consumption Overview (By Stream, Pie chart).
Expand to view the dashboard.

- Kloudfuse Overview dashboard
-
We refactored this dashboard by adding panels that show
agent_type, log lines processed by the ingester for metrics, processed metrics, processed events, and so on.Expand to view the dashboard.

- Alert Statistics Dashboard
-
We created this dashboard so you can see at a glance the information about configured alerts, how many alerts are triggered, how many alerts errored out, how many notifications were sent, and so on.
Expand to see the dashboard.

3.3.0
May 12, 2025
This is a major release. We primarily focused on improving our RBAC offering, and introduced Rate control.
We also made many other improvements: to FuseQL features, Chargeback, Dashboards, Metrics query streaming, Events visualization, overall Infrastructure reporting, and Integration.
Additionally, we fixed a number of issues. See the bugs we fixed in this release, and the bugs in the patch release.
RBAC
- Renamed Pages
-
We changed the tab names for RBAC actions to Manage Users, Folder Permissions, Manage Teams, and Policy Configuration.
- Policy Config Management
-
We removed this feature from the Admin section. Instead, we now associate the relevant policy configurations within the Policies tab, after selecting the relevant Groups. In the Policy Config Management section, click Add policy to assign the policy to that group.
Expand to see an example of Policy Config Management.

-
Users can belong to multiple Groups.
-
Groups can have multiple Policies.
-
Policies can have multiple filters (scopes).
-
- APM stream support
-
Before this release, filters for APM and Metrics streams were combined. You can now configure APM stream filters independently, and apply them correctly to the APM service list and service detail charts.
- Multiple Group access
-
When combining multiple group policies for a user, Kloudfuse now defaults to a more permissive data access rules, a union (logical
OR) of all possible policy filters.We added the Effective Policies section to explain how the various assigned policies resolve for effective access rules.
Expand to see an example of combined effective policies.

- Filter combinations
-
We combine Filters within a Policy using
ANDlogic. We combine Filters across Policies usingORlogic, for each stream. - Policy combinations
-
There are three distinct scenarios for combining policies:
- Scenario 1
-
User has all access across all streams.
p1(all)-all OR p2(custom)-custom filterscode - Scenario 2
-
User has access to custom filters only.
p1(none)-none OR p2(custom)-custom filterscode - Scenario 3
-
User has all access across all streams.
p1(all)-all OR p2(none)code
Rate control
Starting with this release, we are introducing a customizable rate control mechanism that enables you both to limit the amount of data ingested by Kloudfuse, and to prioritize parts of each stream over others by using filters.
You can set a different limit for each stream: metrics, events, logs, traces (APM), and RUM. See Manage Ingestion Rate Control, Rate Control for Metrics stream ingestion, Rate Control for Events stream ingestion, Rate Control for Logs stream ingestion, Rate Control for Traces stream ingestion, and Rate Control for RUM stream ingestion.
FuseQL
- matches
-
We introduced the
matchesoperator to match strings using the RE2-compliant regex format. See Predicate operators for more details. - in
-
We introduced the
inoperator to determine if string or number values are in the search domain. See Predicate operators for more details. - Search across multiple views
-
We now support a single query search across multiple views of the same schema. In effect, we implement a logical
ORacross two or more scheduled views. See Query multiple views.
Chargeback
We expanded Control Plane support by including a consumption dashboard that helps you monitor the chargeback for the streams in your system by Tracking Label and Auth Scope. See Consumption.
Dashboards
- Performance / Streaming support
-
We improved loading times for dashboards with streaming queries. The dashboard render on the page much faster; on long term queries, you may notice that Kloudfuse paints the most recent data first, and then proceeds to paint the rest of the time interval in reverse chronological order.
Whenever you adjust the time interval (time picker change), Kloudfuse cancels the current query.
- Panel rendering
-
We transformed panel rendering to ensure that all panel types render correctly and fully. We also handle queries that return empty results.
Metrics
- Query streaming
-
We improved the performance of charts by streaming the data; you no longer have to wait for charts that display long intervals. Kloudfuse cancels outstanding queries as you change query parameters.
Events
- Events list
-
We standardized the appearance of the Events list with the APM Traces table. It now has a columnar format, in place of a log-type entry. See Events List.
- Lines to display
-
Manage how many lines to display for each event.
- Show absolute time
-
Previously a toggle under Options, this is now a separate optional column.
- Add to Dashboards
-
We added the ability to add an event list table to Dashboards
- Download
-
You can Download the Event List table as a CSV or a JSON file.
- Message content
-
Starting with this release, we parsed the combined Event Message into the following component columns: Event Id, Aggregation Key, Level (status), Event Type, Title, and Message body. We added the Relative time column, and removed the Tags information.
- Event detail
-
When you click one of the Events in the list, Kloudfuse displays the event detail definition. It also includes searchable access to relevant facets and several label categories.
- Filters
-
You can use the Event detail interface to filter on sources, facets, and labels. See Filter and Search Events.
Infrastructure
We harmonized the Infrastructure interface, making it consistent with the rest of the Kloudfuse UI. See Kubernetes Infrastructure
- Filters
-
The Filters navigation lists the Kubernetes Resources: Pods, Clusters, Namespaces, Nodes, Workloads, Network, Storage, and Access Control.
- Facets
-
The left navigation also includes a Facet Search, and existing and tracked facets.
- Search and Group by
-
The main screen includes a Search and Group by affordances.
- Table
-
The table repords infrastructure information for Pods: their Status, Cluster, Namespace, Age, Readiness (how many of total), Restarts (number), % CPU Usage, and % Memory Usage.
- Pagination
-
Indicate how many result to show per page (10, 24, 20, or 75), and navigate between pages.
- Pod Detail
-
Click on one of the table rows to see the detailed information for that pod: Status, Cluster, Namespace, Node, Deployment, Replica Set, Service, Age, Readiness, Restarts, IP, QoS (quality of Service), Tags, Kubernetes Labels, the YAML definition, Logs, Metrics, and Events.
Integration
In this release, we added several new dashboards that you can integrate into your Kloudfuse observability monitoring practice:
- Kubernetes
-
In the Kubernetes Dashboard section, find the following new entries:
Expand to view the Kubernetes Integration page
-
KubernetesOverview - OTel
-
KubernetesClusterOverview - OTel
-
KubernetesNodesOverview - OTel
-
KubernetesJobsAndCronJobsOverview - OTel
-
- System
-
In the System Dashboard section, find the following new entries:
Expand to view the System Integration page

-
SystemDiskIO - OTel
-
SystemMetrics - OTel
-
SystemNetworking - OTel
-
3.2.5
April 7, 2025
We fixed a number of issues. See the bugs we fixed in this release.
3.2.4
March 25, 2025
While this is a minor release, we fixed a large number of outstanding issues. See the bugs we fixed in this release.
Security
We updated Ingress NGINX to address the IngressNightmare vulnerability.
3.2.3
March 14, 2025
This is a major release that adds a significant number of improvements to Alerts, RUM, FuseQL, Metrics, APM, Migration, and Backup and Restore.
Additionally, you can review the bugs we fixed in this release.
Alerts
- Bulk Actions
-
We added several bulk actions to the Alert Rules page.

You can now select all or some of the alerts, and perform these actions in bulk:
- Delete
-
Delete the alert rules.
- Pause
-
Stop the evaluation of the alert conditions; does not send notifications.
- Resume
-
Resume the evaluation of the alert conditions.
- Suppress
-
Stop sending notifications; continues to evaluate the alert conditions.
- Unsuppress
-
Resume sending notifications.
- Clear selection
-
Deselects all boxes.
- Alert Suppress
-
The action formerly known as Mute Alert is now Suppress Alert.
We make a distinction between pausing alerts, and suppressing alert notifications:
- Pause
-
Paused alerts do not get evaluated, so they never issue an alert notification. When a user deliberately resumes the alert, Kloudfuse starts evaluating the rule that can trigger an evaluation.
You can pause alerts as part of a bulk action, or from the Create Alert / Edit Alert interface.

- Suppress
-
Suppressed alerts still get evaluated, yet do not fire notifications if alert conditions exist.
You can suppress alerts as part of a bulk action, or by hovering over the Alert rule in the list of alerts, clicking the
 (suppress) icon, and then selecting the defined time interval, from Next 5 minutes to Next 7 days.
- Suppress Alert Schedule
-
You can create complex, multi-component schedules for suppressing alerts.

Subsequently, edit a contact point, and attach the correct Suppress Schedule.

- No Data Handling
-
This release adds the Evaluate as zero option to account for missing data from alert query conditions.

See also Metrics: Default Zero.
Real User Monitoring (RUM)
- Add and Manage Applications
-
Implements CRUD operations for applications, by name, type, ID, client token, and so on, through the UI instead of the
configfilecustom-values.yaml.For full information, see RUM Add New Application.
- Overview URL panel
-
When you click a panel or chart, it opens a new URL on the right side of the screen.
For example, click the Longest INP by URL, and it opens the full report screen that clearly identifies which URL causes the delay.
 Overview URL panel
FuseQL
We expanded the offerings within our proprietary query language, FuseQL.
- Scheduled Views
-
Starting with this release, you can create scheduled views, and query directly from that view.
Scheduled views are pre-aggregated datasets that Kloudfuse generates at scheduled intervals to improve query performance and efficiency. Instead of expensive real-time queries on raw data, scheduled views store advance results, enabling faster access to summarized information.
This is how to use a scheduled view:
-
Define a FuseQL query – specify the filters and aggregation logic.
-
Create the scheduled view – it updates every minute for near real-time data availability.

-
Store precomputed results – the system processes the query and saves the aggregated results, separately from the log data.
-
Query the view – users can access the scheduled view results through FuseQL, instead of running raw data queries. This approach ensures faster performance with current insights.
-
Disable or pause the scheduled view – users can disable, pause, or temporarily stop updates on a scheduled view without deleting it, and then resume processing as necessary.

-
- New Operators
-
We added
backshiftanddedupoperators to support querying of Scheduled Views. - Dashboards
-
Create new dashboards based on results of Advanced Search across logs.
- Alerts
-
Create new alerts based on results of Advanced Search across logs.
- Lookup tables
-
Create and use lookup tables to supplement your data.
-
Under the Logs tab, navigate to the new section Lookup Tables.

-
Review the list of Lookup Tables.
-
Click Create Lookup Table, upload the source CSV file and name the new table.
The preview of the data shows the fields. You can change the data type for each column. Be sure to identify at least one primary key, and click Create Lookup Table.

-
Metrics
- Analytical Views
-
This release significantly expands the analytical features for Metrics by adding Top List, Table, and Pie Chart analytical views to Metrics Explorer.
This view provides a quick summary of top N metrics that match the filter and time interval criteria. It helps with high-level analysis of metrics in your system.

This view is a quick summary of top N or bottom N metrics that match the filter and time interval criteria. It helps with high-level analysis of metrics in your system. You can sort by any attribute/column.

This view is a quick summary of metrics that match the filter and time interval criteria. It is a visual representation of proportional weight of a metric across the data from the time series. The pie chart view also includes the table representation of the items on the chart; you can sort by named columns.

- Default Zero
-
We added an interpolation function,
default_zero, to handle missing data in Metrics Time Series.
See also Alerts: No Data Handling.
APM
- Deployment Version Marker
-
We added the existing deployment version markers to the graphical APM Trace List information.
![APM Trace List][[service-list]](../_images/apm-deployment-marker-trace-list-3.2.3.svg)
Note that we already use them on the Service Detail page.
![Service detail with deployment marker][[service-detail]](../_images/apm-deployment-marker-service-detail-3.2.3.svg)
Migration
We deprecated the Kloudfuse Catalog Service in a previous release. Start Using Kloudfuse Customer Scripts instead.
- Dashboards
-
To migrate existing dashboards into the Kloudfuse system, use the consolidated script approach. See Importing Dashboards.
- Alerts
-
To migrate existing alerts into the Kloudfuse system, use the consolidate script approach. See Importing Alerts.
3.2.2
February 13, 2025
This release adds improvements for APM, RUM, Logs, and Dashboards.
Additionally, you can review the bugs we fixed in this release.
APM
- Side Bar Filter
-
For the Service, Traces, Analytics, and Error pages, we restricted the number of displayed results to improve performance. Kloudfuse, by default, sorts labels and attributes in descending order, and displays up to 1,000 items.
- Side Bar Search
-
Search now leverages regex for the
containsoperation. - Multi-Query Support
-
We now support Kubernetes and Host metrics exported by the Otel collector when rendering the APM Infrastructure Dashboard. See OTel Collector on Kubernetes.
We also improved the filtering selection refresh on the Side Bar; see Side Bar Filter.
- Inactive Services
-
We removed the Show Inactive Services option. Instead, the Services interface has two viewing options: the default Active Services, and All Services.

RUM
We enhanced the RUM Performance Overview UI.

- Overall Performance Metric
-
We added a Tree Visualization to track the values of the overall performance metric. Loading Time is the default metric; you can also choose Largest Contentful Paint, Cumulative Layout Shift, and Interaction to Next Paint. This chart reports the health of the metric across the system, color-coding for Good (green), Needs Improvement (amber), and Poor (red) statistical measurements, based on customer specification.
- Optimize Vitals
-
We added three more visualizations: Loading Time, First Contentful Paint, and User-Centric Page Load Times latency reports. The existing latency reports include Large Contentful Paint (LCP), Cumulative Layout Shift (CLS), and Interaction to Next Paint (INP).
- Worst Performance Report
-
We highlighted the URL addresses of the pages with the poorest performance in terms of Longest INP, Largest CLS, and Slowest LCP.
3.2.0
January 24, 2025
This release focuses on further refinements to our existing features.
Alerts
- Threshold Alerts
-
We added support for warning threshold, alert recovery, and warning recovery thresholds to threshold alerts on metrics, logs, and services. You can also link alerts to dashboards and panels, pause alert evaluation, and link back to the Kloudfuse alert page from alert notifications.
 Create a Metric Threshold Alert
 - Log Alerts
-
We added support for linking in log alerts, and display matching log lines in alert notifications.
Stream Isolation
You can now Pinot Stream Isolation and route specific telemetry streams to tagged nodes.
RBAC
- APM
-
Permissions now persist for downstream and upstream dependencies that cross cloud, Kubernetes cluster, and namespace boundaries. When you set policy filters using service id labels, Kloudfuse supports cross-boundary permissions, and applies RBAC policy filters to both active and inactive services.
- Stream-Specific RBAC
-
We now support RBAC policies at the level of the data stream. While default RBAC policies apply to all non-RUM streams, you can pin custom RBAC policy filters to a specific stream, such as logs, metrics, or RUM.
 Create a Stream-Specific Custom RBAC Policy
 - Private Folders
-
You can now create private folders, where only the creator has access to the folder contents.
 Create Private Folders
 - User Interface Improvements
-
We made changes to warn users with viewer roles about their permission limitations when they attempt to add, edit, and delete dashboards and alerts.
Dashboards
You can now create new folders in the Dashboards main/default page; simply click  at the top right.

FuseQL
We made several improvements and a small number of fixes to the FuseQL functionality. Critically, we significantly enhanced the Advanced Search parsing by adding support for regular expression parse variable pattern recognition with and without start and stop anchors, and JSON pattern parsing. See Parse operators.


3.1.2
January 8, 2025
In our first release of the year, we chose to implement fixes to various UI pages, and improved our Alerts functionality.
Integrations
We updated content on the Integrations tab, and included icons for easier identification of third-party agents, services, and so on.
Real User Monitoring (RUM)
- RUM Session IP
-
We improved the handling of IPs recorded in RUM sessions.
- RUM Geo Location and Mapping
-
We added a geographical location extension for RUM, and the ability to handle the user-provided IP:location mapping.
- Mobile RUM SDK
-
We made improvements to the SDK for Mobile RUM.
- RUM Alert Fixes
-
We improved the functionality of RUM alerts.
3.1.1
December 31, 2024
In our last release of the year, we completed some bug fixes and refreshed the UI.
Let’s get ready for 2025!
3.1
December 24, 2024
This release includes further refinements for our existing features.
Integrations
- Integration UI
-
To better assist you in configuring your data streams into the Kloudfuse platform, we added an Integration section to our UI.
You can browse the site to select the appropriate agents, cloud services, storage services, platforms, and so on, to research the best integration solution for your business needs. You can also use the Search function.

- New Relic Agent
-
The Kloudfuse platform now ingests span and trace data sent by New Relic Agent agents and SDK.
- Prometheus Pushgateway
-
The Kloudfuse platform now ingests ephemeral and batch metrics data sent by Prometheus Pushgateway.
Query Languages
FuseQL, our proprietary Query Language for searching logs, now offers Advanced Search (free-form search), and fully supports the Logs Analytics screens.
- Advanced Search
-
Operates like a pipeline, progressively narrowing down results to help you find exactly what you need. Each operator, separated by a pipe (|), builds on the results of the previous one. This enables you to filter and focus your search with precision as you move through the pipeline.

- Search Bar and Query Builder
-
FusesQL is part of both the Search Bar and the Query Builder for Logs Analytics: Time Series, Top List, Table, and Pie Chart pages of the Logs interface. Starting with this release, FuseQL is the default query language for logs.

- Conversion Functions
-
In addition to
toInt, we added two more type conversion functions:toLongandtoString.
SLO
We added the metric detection SLO in this release, to supplement our existing support for SLOs based on latency and availability.

Enhanced Analytics
For logs, metrics, events, and APM, you can now create and edit dashboard panels and alerts directly from the Analytics interfaces.
- Dashboard Panels
-
Click the Export icon, and proceed to name the new panel and save it in a new or existing dashboard.

- Alerts
-
Click the Alert icon, and create alerts based on the current analytical setting. This feature is part of all Analytical interfaces (Time Series, Top List, Table, and so on) for APM, Metrics, Logs, and Events.

3.0
November 6, 2024
This release includes two significant innovations in Kloudfuse platform, Real User Monitoring and FuseQL query language. It also adds significant troubleshooting and analytics tools to the APM system by introducing Trace Heatmap and K-Lens.
Real User Monitoring (RUM)
RUM allows you to capture and analyze data from real users as they interact with your web application, providing insights into their experience and identifying performance issues from the user’s perspective.
We encourage you to look at our introductory video on how RUM addresses the many requirements of Digital Experience Monitoring:
Read about our implementation in RUM Setup and Real User Monitoring (RUM).
FuseQL
Kloudfuse developed its proprietary query language, FuseQL, for a range of applications. It has flexible parameters for answering highly complex questions.
To understand the defining characteristics of FuseQL and how to use it, see FuseQL.
APM
This release introduces two powerful new APM observability tools, APM Trace Heatmap view and APM K-Lens, to assist in service-level issue detection and advanced debugging using APM Trace data.
- APM Trace Heatmap view
-
This interactive trace data visualization chart helps you to visually detect deviations and outliers in the latencies reported by APM data.
- APM K-Lens
-
Our proprietary analysis tool that helps you to narrow down the cause of appliance performance issues; it compares thousands of attributes across span events to their baseline performance, and displays ranked results based on significance of deviation.
We encourage you to look at our introductory video about this feature:
Enterprise Readiness and Security
We enhanced our SSO support by adding SAML-based authentication for providers such as Google, Okta, and many others. See SAML SSO Authentication.
2.7.4
September 2024
Metrics Roll Up
Kloudfuse supports roll up and aggregation of metrics data, computed directly from the raw data stream during ingestion. For longer time intervals, our approach significantly improves query performance, and reduces chart loading times and I/O costs. Depending on the time span or step size of the query, Kloudfuse calculates results either from raw data, or from rolled up data. In the shorter time spans, we continue to use raw metrics because the calculation approach could potentially smooth out the data and miss important signals, such as outliers.
Metrics roll up is off by default, and the default aggregation is for 5 minutes. Contact us to turn on metrics roll up, and help you configure your environment.
For more information about this feature, see Rolling up Metrics.
Service Catalog
Until this release, the Kloudfuse APM interface showed only the services that sent data within the selected time block. We now show all services, including the ones that may be stopped or paused.
To see all services, simply toggle the Show Inactive Services selector. You can see that two new services in this example, frontend-web and loadgenerator, appear in the service list. Because the services were inactive during the relevant time interval, they have empty columns.

Facet Exploration and Analytics
Logs default sidebar Open facets-in-left-bar.png facets-in-left-bar.png Kloudfuse automatically extracts facets attributes from logs during ingestion. Before this release, we surfaced facets in the Logs side bar, organized under Sources.
Because the number of sources and facets can quickly become very large, the troubleshooting tasks become more difficult and the feature is not as useful as we want it to be. In this release, we re-organized the sidebar to include expandable sections as these components: Filters, Labels, and Facets.
We now organize Facets in their own section. Users can create custom groups that include the facets they want to monitor, across any number of sources.

You can group facets by source, and use the search bar to find relevant groups.
When you expand a group (here, the logs-parser), you can see some of the facets tracked in the group. We also added a search bar in each group to help you locate a facet by name.
Facet Explorer
Click the icon on the Facets title line, and Kloudfuse opens the new Facet Explorer. When you choose a source (logs-parser to continue this demonstration), you can typically see many more named facets than you see in the Logs sidebar.

Facet Favorites
This release also introduces Facet favorites that optimize facet design and usability; you can hover over one of the facets, and click on the hollow icon to “favorite” that facet. In the Edit Favorite interface, simply decide if you want to add the facet as a favorite to the existing group, or create a new group. You can even change the display name of the favorite facet.
Because of these changes, and other usability improvements, you can now control the organization and visibility of facets much more effectively:
-
From the log event detail pane, you can select a facet and add it do the side bar.
-
You can organize facets by user-defined groups, so the sidebar has a single-level folder structure.
-
The Logs page now has a Facet Explorer option that enables you to browse across all facets, add facets, and remove them.

Changes to existing Kloudfuse UI
-
In the Logs interface left sidebar, Facets replace Sources.
-
When creating/changing Favorites, you can “remember” the source by selecting that option.
-
Upgrade note: The log facets that appeared in the sidebar before this release are now hidden. After upgrading to Kloudfuse Release 2.7.4, Use the Facet Explorer to identify the facets you want to see in the sidebar as “favorites”.
Log Archive and Hydration
You may have to save transactional information for compliance, legal, or other regulatory requirements. In addition to processing logs for observability and analytics, this release of Kloudfuse introduces a supplementary mechanism for archiving pre-processed logs (with identified filters, facets, and so on) into longer-term storage, and a separate mechanism to hydrate these logs to examine them for the relevant data.
The benefits of this approach extend beyond basic regulatory compliance:
You store important historical data in a cost-effective compressed format in a location that you own and control.
When uncompressed, the logs are human-readable and highly searchable because of the high level of indexing through labels and other data attributes.
You can configure the archival instructions in a manner that categorizes data consumption by internal cost center.
We currently support log archive and hydration for AWS S3.
To start hydrating previously archived logs, select Logs in the top navigation bar, and then choose Hydration.

Contact us at support@kloudfuse.com to enable this feature in your Kloudfuse cluster.
For in-depth information on this feature, see Logs Hydration.
Log label cardinality analysis
Log labels have two main source: many are attached by the agent that delivers the logs to the Kloudfuse platform, and potentially even more are defined by users. Some labels are meaningful at the time they are defined, yet loose their relevance over time. Some are created accidentally, or as a result of not fully understanding the common use cases or the purpose of log tracking. Automatically-generated labels, from agents, are often cryptic and unnecessary.
Seeing cardinality analysis of a log helps users to remove unnecessary labels, improving data accessibility and making the collected information more actionable.
To determine log label cardinality, select the Logs tab, and then the Cardinality Analytics option in the dropdown menu.

The Logs Cardinality report shows the overall cardinality; in this case, the cardinality is 335. It further breaks out the data by Label, showing the Value Count (1h) for the preceding hour, the Value Count for the specified most recent time range (the last 5 minutes is the maximum time range and the default setting), and the Value Chart, which is a simple bar chart representation of the count of unique values over the selected time range.

To find the prevalence of a specific label value, use the filter at the top of the page to select a label, the operator, and the comparison value.
Graviton support
Starting with this release, Kloudfuse platform can run on instances that are based on AWS Graviton processors.

For more information, see AWS Graviton Processors documentation.
RBAC improvements


2.7.3-p1
September 6, 2024
OpenTelemetry on Docker deployments
In this release, we added support for data collection through OpenTelemetry on Docker containers. For details, see OpenTelemetry Collector on a Docker Environment.

Trace (APM)
- Prettify JSON
-
For the Trace > Log details interface, we improved the display of the JSON format of the log line.
Select the Pretfify JSON option to see the more familiar and easy to read rendering of the log line.

- Trace Span Details
-
When examining Trace Latency Breakdown detail, under the Logs option, we added a new filter option. Depending on the nature of your technical stack, you can now select to filter on Kubernetes (
pod_name), Docker (container_id), or Host (hostname).To select the relevant filter:

-
On the top navigation bar, select APM > Traces.
-
[Optional]
Use Search to find the relevant service.
-
In the List of services, click the relevant Trace Latency Breakdown diagram.
-
In the detail, under the Flame Chart, select the Logs tab.
-
The header of the list starts with the Filter, set to
traceIdby default. Click, and select the relevant filter from the drop-down.
-
2.7.3
August 28, 2024
In this release, we made changes to Logs, APM, and RBAC:
Logs
We made significant improvements to the performance of log search with efficient indexes; comparable searches are now an order of magnitude faster.
RBAC
We added default access policies for users without explicit policy assignment. See Default Policy.
2.7.2
August 19, 2024
RBAC(Role Based Access Control)
We are introducing a new UI support for easier user management:
-
Define Roles assigned to users in the UI.
-
Handle Users, Groups, Policies, and Policy Config with ease from UI.
-
Enjoy improved user and access controls.
Starting with this release, KloudFuse does not support RBAC and policy configuration by editing raw configuration files.
2.7.1
2.7.0
July 29, 2024
Kloudfuse 2.7 is a major release with many enhancements and critical bug fixes.
This release has a kafka upgrade that requires specific steps.
APM
Traces
-
Support for non-request (background jobs) transactions for elastic APM.
Service Details
-
Support for Apdex charting and alerting.
-
Service Execution Time chart shows breakdown by the downstream external service by their DNS names/IP addresses.
-
Downstream dependency table now also shows external services.
UI
Bookmarking and State Management
-
Support for bookmarking filters and query states
-
State is preserved within the stream pages while navigating around the kfuse UI.
-
Unified rollup period across all charts
-
UTC support
-
Allow sorting for analytics table and pie chart table
Logs
Improvements
-
Unify Logs Analytics and Trace Analytics to allow multiple queries
-
More responsive logs landing page through streaming and faster terms search
-
Support for larger log lines - up to 1MB
Control Plane
Improvements
-
Improve dashboards for Kloudfuse Overview, Systems, and so on.
-
Additional panel to show Agents Overview
-
Support for Outlier analysis
Alerts
Improvements
-
Support for creation of alerts by cloning an existing alert.
-
Support bulk deletion of alerts and contact points.
-
Slack contact point editing support
-
Support Apdex-based alerts
2.6.7-p1
May 30, 2024
Kloudfuse 2.6.7 is patch release with some critical bug fixes.
Bug Fixes
-
Fix for RBAC exception when navigating to live trace and APM Derived Metrics. Applies only if RBAC is enabled.
-
Fix for Alignment of values between “Total Requests” and sidebar span counts in the Traces screen.
-
Fix for No Data/Exec State alert condition
2.6.7
May 15, 2024
Kloudfuse 2.6.7 release builds on the 2.6.5 version and continues to improve APM, Logs, and UI. We added support for defining Service Level Objectives (SLOs) at service level, and enhanced Logs Search with additional search operators.
This release also includes many performance improvements, bug fixes, and several minor enhancements.
APM
Databases
-
Databases are now uniquely identified by a user-configurable set of attributes with a reasonable default that includes key cloud and kubernetes attributes. This is similar to service identifiers for Web services.
Service Level Objectives (SLOs)
-
Kloudfuse added support for Service Level Objectives (SLOs). Users can set latency and availability SLOs for any service instrumented with distributed tracing.
-
Every SLO breach can send optional alerts.
-
The Service page includes a high-level summary of any configured SLOs.
Service Details
-
Supports runtime metrics (node.js) for services based on detected telemetry language.
-
Service details page provides quick access to the logs through the Logs tab.
Traces and Flame Graph
-
Trace details and flame graph now support granularity measured in nanoseconds.
Logs
Facet terms exists
-
Logs search has two new operators to support term search within a facet,
facetTermsExist(==)andnotFacetTermsExist(!==).This is similar to
facetTermsExistfor the full log line:
Filter Performance
Performance improvements to reorder filters based on their efficiency, while executing queries in the database. This can have a considerable effect on user experience.
Disk Reads for Filters
Improved and reduced disk reads in termsExist filter execution.
2.6.5
April 10, 2024
Kloudfuse 2.6.5 is a major release that significantly enhances the APM user experience by introducing the concept of service identifiers, which allow APM services to be uniquely identified by a user-configurable set of attributes with a reasonable default, and includes key cloud and kubernetes attributes.
This release also includes various security fixes to address CVEs, many performance improvements, bug fixes, and other minor enhancements.
APM
Services and Databases List
-
We now display services and databases separately in their own tabs.
-
Services are now uniquely identified using a combination of cloud and kubernetes labels. Service identity is carried over to the service, dependency maps, and service details page. Additionally, Kloudfuse leverages service identity to set APM and ASM alerts and to navigate to traces and errors from service details.
Service Details
Runtime metrics (JVM, Go, Python, and so on) for services based on the detected telemetry language.
Service Map
-
Significant enhancements to the Service Map (global view) and Service Dependency Map (in the Services details page) user experience, leveraging service identity to uniquely identify services and databases
-
Ability to navigate from service to service details page
-
Ability to size the node based on any of the RED metrics
2.6.0
February 16, 2024
Kloudfuse 2.6.0 is a major release that includes significant UI improvements, and many new APM and Dashboard features.
UI Enhancements
Sidebar
-
Independent scrolling of sources and facets
-
Easier selection of facets, and labels using toggle All/only options
-
Easier charting of facets based on data type, directly from the Logs sidebar
Search bar
-
Uniform and easier editing of search filters across Logs and APM search bars
General UI improvements
-
Better color, fonts, and sizes
-
Uniform look and feel across various screens
Dashboards
Dashboard Edit
-
You can create, delete, and edit APM, Logs, and Metrics dashboards
-
Kloudfuse has Dashboard import, export, and copy functionality.
-
Dashboard templates support variables
Metrics
Metrics Metadata
Kloudfuse now supports the use of Metrics metadata, including metric type, description, and units.
APM
Advanced Services Monitoring (ASM)
-
You can enable ASM for individual services from the APM services list.
-
With ASM enabled, you can show anomalies in RED metrics charts.
-
Service details page shows Kubernetes Infrastructure metrics on per host, and per pod basis, with outlier detection.
Deployment Tracking
-
Auto-detection of deployment changes based on service version
-
Service details page shows first seen time for each of the versions.
-
Service RED metrics and Execution Breakdown charts show markers for deployment.
Service Execution Time Breakdown
-
Breakdown of execution time by downstream service and span type
-
Overlay of deployment markers to correlate deployment changes with service changes
Additional Service Reports
-
We added SLA daily, weekly, and monthly report of RED metrics and Apdex.
-
We added a Performance Report that breaks down RED metrics and Apdex by span names for 24 hour period against a 7 day average.
2.5.4
January 6, 2024
Kloudfuse 2.5.4 is a minor release with a few enhancements, performance improvements, and bug fixes.
2.5.3
December 26, 2023
Kloudfuse 2.5.3 is a minor release. It includes Logs facet autocomplete with typeahead, APM trace search enhancements, performance improvements, and bug fixes.
2.5.2
December 13, 2023
Kloudfuse 2.5.2 is a minor release with performance improvements and bug fixes.
2.5.1
December 10, 2023
Kloudfuse 2.5.1 is a minor release with improved alerting capabilities and performance and bug fixes.
2.5.0
November 21, 2023
Kloudfuse 2.5.0 is a major release with many improvements, new features, and bug fixes.
Logs
Additional Visualizations in Logs Analytics UI
-
Logs Analytics now supports Top List, Table, and Pie Chart visualization. This adds to the Time Series visualization of previous releases.
-
You can aggregate facets, or used in a group that is independent of the source in which they appear.
-
Create alerts directly from the logs analytics screen for both queries and formulas.
-
Kloudfuse has new aggregation functions: first, last, quantile, and so on.
Log Facets
Facet match/search now works across all sources.
Logs Search
-
Logs term search and string search are now faster due to numerous improvements in indexing, caching, and streaming evaluation of counts.
-
From the search bar, search for log lines that contain facets.
-
Sort the logs search results table by custom columns.
-
Chart numeric facets from the sidebar.
-
The sidebar shows facet values, sorted by their count of log lines.
APM
Service Detail UI Improvements
Improvements to the charting interface, and ability to jump to corresponding metrics exploration with support for more visualization types and comparison to previous time periods.
APM Analytics UI Improvements
-
Added support for Top List, Table, and Pie Chart visualization, in addition to the existing Time Series visualization.
-
Support for multiple queries and formulas.
-
Simplification of Analytics UI to match logs analytics.
-
Ability to add analytics queries to dashboards
Cardinality Analytics
Support for analyzing and breaking down cardinality of various attributes, both indexed and non-indexed.
2.2.4
This release adds many performance improvements and features for Logs and APM.
Logs
Fingerprint tab improvement
You can now sort Logs fingerprints by ascending or descending log count.
Log UI Improvements
You can now search Logs sources and facets in the sidebar.
APM
APM dashboards
APM dashboards now show the breakdown of RED metrics by services.
Various bug fixes and Performance Improvements
-
Services view sidebar loads faster.
-
Service Detail view breakdown charts by Span Name supports selection using the legend.
-
Links from a specific error group details to the “Errors” page.
UI improvements
Spinner is now displayed in the APM page for initial load. We fixed word wrap and UI distortion issues on many charts.
2.2.3
This release introduces Term search for Logs, and External Dependency Tracking for APM services. We also made several improvements for Logs, APM, Infrastructure, and Platform.
Logs
Term Search for Logs
Term search is now the default search type for logs. Users can quote the search string to use the older 'string contains' search. Term search is faster and more efficient, in general.
Log Analytics UX improvements
We simplified and streamlined Logs analytics UI. You also have an option to add the queries to a dashboard.
Fingerprint Analytics
You can now group fingerprints by multiple attributes. Earlier, the only grouping before this release was by the source attribute.
APM
Dependency Tracking for APM
The external dependencies for APM services appear in the service details page.
Related Logs and Metrics in Span Details
When you select a specific span from the trace details, you can now see the related logs based on various attributes, including traceId, pod, and many others. You can see the metrics related to the service or endpoint.
Performance Improvements
We significantly improved the speed for queries for rate (for counter type) and histogram quantile (for histograms).
UI improvements
Spinner now displays in the APM pages while columns values are not yet available.
2.2.2
This release introduces a key new feature, Error Analytics for Elastic APM. We also made improvements to Logs, APM Distributed Tracing, and Metrics.
Error Analytics
Elastic APM Errors
Users can now perform analytics on Elastic APM errors globally, and also see error types, frequency, and last occurrences for a specified service.
Logs
JSON log sorting
Before indexing, Kloudfuse now sorts each input JSON log line internally by key names. This improves the storage efficiency and search speed, reducing the number of unique patterns detected in the log streams.
2.1.0
This release introduces two new features, Advanced Service Monitoring and TraceQL support. We also enhanced Logs, APM Distributed Tracing, and the Control Plane.
Advanced Service Monitoring (ASM)
Automatic Observability
ASM provides autonomic observability based on eBPF technology. The kfuse-knight agent discovers and tracks all services and their interactions. ASM delivers RED and USE metrics without any extra instrumentation or change to the application code. It also curates advanced alerts to detect anomalous and outlier behavior in the services.
TraceQL
Query Spans
Using TraceQL, you can query spans. You can also view a service map and flame graph through Grafana.
Logs
Skip auto-facet extraction from JSON logs
You can now optionally skip auto-extraction from JSON logs by changing logs parser configuration.
Fix data type identification
We corrected the broken charting for grammar-derived facets.
Efficient JSON log message parsing
We optimized JSON message parsing to reduce the CPU cost for logs parsing. This applies to all log lines, including structured JSON logs, embedded JSON, and partial JSON strings.
APM Distributed Tracing
Trace detail enhancements
Span details now show stack-trace, local variables, and context for Elastic APM. Also, flame graph spans list appears under a separate span list tab.
Ability to filter by custom span attributes
From span details, you can now filter by (include/exclude) custom span attributes, in addition to the standard OTel attributes.
2.0.0
This is a major release with significant feature enhancements for our customers.
Streamlined filtering
Streamlined filtering based on labels and facets across various streams
We standardized and streamlined filtering and navigation across all streams, including logs, traces, events, and metrics.
Service Level Objectives (SLO)
Service Level Objective (SLO) Support
Kloudfuse now supports Service Level Objectives (SLOs). Users can set latency and availability SLOs for any service instrumented with distributed tracing.
Single Sign On (SSO)
Single Sign On (SSO) Support
Kloudfuse now supports Single Sign On and several authorization methods, including Google, Okta, Azure, and others.
Alerting
Enhanced Alerting Support
Kloudfuse alerting now supports Change, Outliers, Anomaly, and Forecast alert types in addition to the existing Threshold alerts.
Migration
Simplified migration for grafana dashboards and alerts
Kloudfuse catalog service supports the migration of dashboards and alerts from external Grafana to Kloudfuse.
Logs
Automatic facet datatype detection
Logs parsing extracts, detects and color codes the data types of facets automatically to make it easier to work with large amount of logs data.
Externalized Logs parser configuration
You can configure Logs parser pipeline stages through remap, relabel, and transform actions/stages. This enables users to configure and process logs data from any agent, including fluent-bit, fluent-d, OTEL collector, DD-agent, and many others.
More efficient JSON log message parsing
We optimized JSON message parsing to reduce the CPU cost for logs parsing. These optimizations apply both to structured JSON and to log lines that contain embedded or partial JSON strings.
APM and Distributed Tracing
Support for Datadog, Elastic, and Otel agents
In addition to the OTEL collector/format, Kloudfuse stack now supports Elastic APM and Datadog APM payload formats. You can configure the pipeline to drop and relabel various attributes, as required.
Unified span-derived metrics and user-derived trace metrics
Kloudfuse stack produces unified span-derived metrics that you can configure to have arbitrary dimensions. To produce additional span-derived metrics, apply any filters and time/space aggregates to incoming data. Retain the metric data independently of trace retention.
Span/Trace download support
Users can download the full span data in two different formats:
-
CSV: download only the columns that appear in the UI. -
JSON: download all the attributes of the incoming span stored by the stack.
Alerts
Enhanced Alerting
Kloudfuse alerting now supports Change, Outliers, Anomaly, and Forecast alert types, in addition to the existing Threshold alerts.
1.3.3
This is a minor release update with the following feature enhancements for our customers:
Logs
Composite Sorting
Log data is sorted by multiple keys (fingerprints, labels, timestamp); this results in more efficient disk storage, and therefore better query performance.
Saved Query
You can save log queries as views, and reference them later. You can also save them as adhoc dashboards for use by team members.
Log Download
Download Logs events from the Kloudfuse UI. The logs download is limited to 10MB.
We support three different download formats:
-
TXT: Raw log message as emitted by the application. -
CSV: Comma-separated log message, along with all fields that appear on the Kloudfuse Logs UI screen. -
JSON: Full detailed log events with all facets and labels associated with the log event.
1.3.2
This is a minor release update, with performance improvements and feature enhancements for our customers.
Metrics
Improved metric segment seal times
On E2 machines, metric segments used to take 4-10 minutes due to number of docs in each segment (~50M). We moved to columnar seal instead of row-by-row seal, and seal times decreased by 50% or more.
Logs
Fluent-D support
Kloudfuse can now ingest logs from Fluent-D directly. We support JSON and msg-pack formats.
Fingerprint sorting-based segment disk layout
We now sort the log lines on the disk based on their fingerprint. This results in better storage compression and improved search performance for both grep and facets.
APM Traces
Support for missing and no-root spans
We now support flame graph view for incomplete traces. In certain customer environments, we may not get a root-span or parts of traces may always be missing due to environment setup. We improved the flame graph visualization to render such traces correctly.
Improved span segment encoding
To improve query speed, we moved to dictionary-based encoding for span durations and bigger segments.
1.3.1
This is a minor release update with support for better analytics.
Analytics
Auto Alerting and Analysis with Hawkeye and Bullseye
With the right instrumentation in place, Kloudfuse analytics can now do auto alerting and analysis. Using Hawkeye, you can easily enable auto-alerting for automatic monitoring of all Kubernetes services for anomalies on their RED metrics. Auto-analysis capability using Bullseye generates an analysis report with possible reasons for the alert (anomaly).
