GCP Integration Architecture
Kloudfuse supports two parallel paths for ingesting Google Cloud observability data: a log pipeline built on Cloud Logging and Pub/Sub, and a metrics pipeline powered by the Prometheus Stackdriver Exporter.
Overview
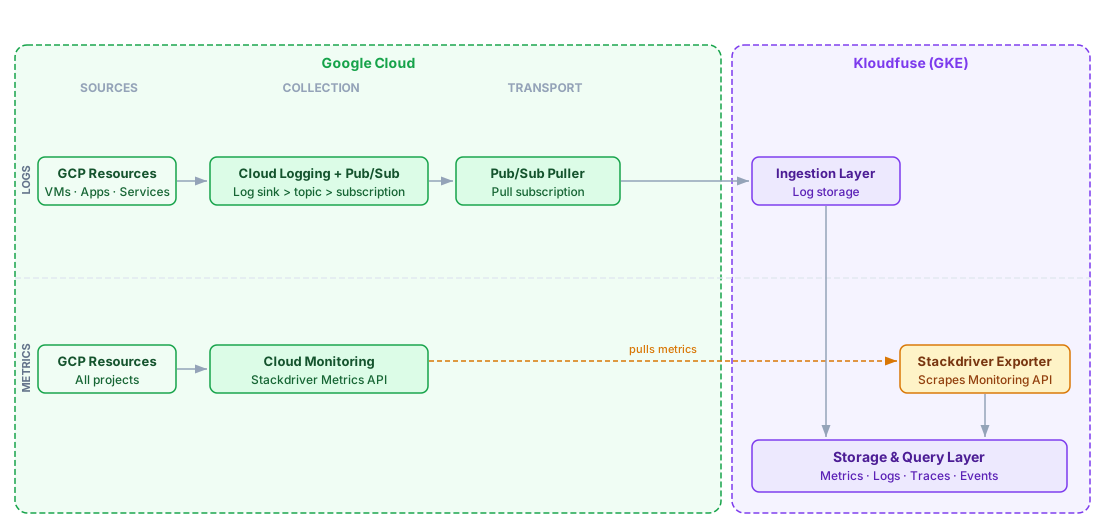
GCP integration uses two independent pipelines that can be deployed together or separately:
-
Log pipeline — GCP resources emit logs to Cloud Logging. A log sink routes those logs to a Pub/Sub topic, and Kloudfuse pulls the messages from a Pub/Sub subscription.
-
Metrics pipeline — The Kloudfuse Prometheus Stackdriver Exporter, running inside your GKE cluster alongside Kloudfuse, periodically scrapes the Cloud Monitoring (Stackdriver) Metrics API and stores the results in Kloudfuse.
Both pipelines write to the same Kloudfuse Storage and Query Layer, so logs and metrics from the same GCP resource appear together in the Kloudfuse UI.
Log Collection Pipeline
Data flows as follows:
-
GCP resources (Compute Engine VMs, GKE nodes, Cloud SQL, App Engine, and others) emit log entries to Cloud Logging.
-
A Log Sink routes those log entries to a Pub/Sub topic.
-
Kloudfuse maintains a pull subscription on that topic and continuously pulls batches of log messages.
-
Kloudfuse writes the log records to its storage layer and makes them searchable in Log Analytics.
This pipeline is near-real-time: logs typically appear in Kloudfuse within 30–60 seconds of being emitted by the GCP resource. The pull model means no inbound network rules are required — Kloudfuse initiates all connections outbound to the Pub/Sub API.
Metrics Collection Pipeline
The Prometheus Stackdriver Exporter is an open-source exporter that runs as a pod in your GKE cluster alongside Kloudfuse. It calls the Cloud Monitoring (Stackdriver) Metrics API on a configurable interval to retrieve metric data points for the specified projects and metric type prefixes.
Data flows as follows:
-
GCP resources publish metrics to Cloud Monitoring (Stackdriver).
-
The Stackdriver Exporter polls the Cloud Monitoring Metrics API and retrieves metric data.
-
The Stackdriver Exporter exposes the metrics in Prometheus format, which Kloudfuse scrapes and stores.
Because the Stackdriver Exporter runs inside your cluster, no inbound firewall rules are required.
Only outbound HTTPS access to the Cloud Monitoring API endpoint (monitoring.googleapis.com) is needed.
Metrics Enrichment
In addition to raw metric values, Kloudfuse can enrich metrics with resource-level labels scraped from GCP — for example, custom labels applied to Compute Engine instances.
Enrichment runs on a separate configurable interval (default: 30 minutes) and requires the roles/compute.viewer IAM role in addition to roles/monitoring.viewer.
See Configure GCP Metrics Enrichment for the full configuration.
Authentication
Both pipelines authenticate to GCP using a Service Account with a JSON key:
| Credential | Where it is used |
|---|---|
Service account JSON key ( |
Stored in a Kubernetes secret; used by both the log puller and the Stackdriver Exporter |
|
Required for the log pipeline (Pub/Sub pull) |
|
Required for the metrics pipeline (Cloud Monitoring API) |
|
Required for metrics enrichment (GCE instance labels) |
A single service account can hold all three roles, so both pipelines can share the same Kubernetes secret (kfuse-gcp-credentials).
Choosing an Integration Method
| Requirement | Use |
|---|---|
Collect GCP activity and resource logs |
|
Collect Cloud Monitoring metrics |
|
Full GCP observability (logs and metrics) |
Both pipelines — share a single service account with all required roles |
Next Steps
-
GCP Log Integration — Set up the Pub/Sub log pipeline.
-
GCP Metrics Integration — Configure the Stackdriver Exporter for Cloud Monitoring metrics.
