SARIMA
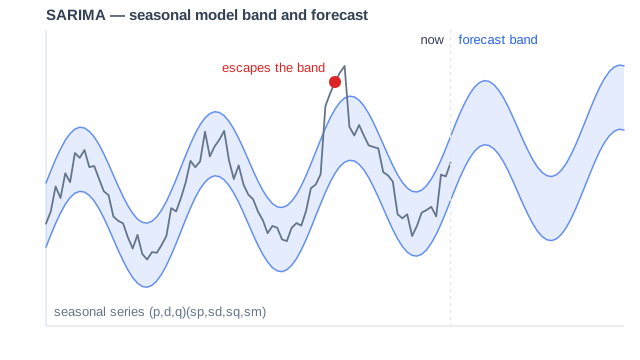
SARIMA is the abbreviation for Seasonal Autoregressive Integrated Moving Average, a time series analysis in the fields of statistics and econometrics. In Kloudfuse, we implement the SARIMA algorithm as the agile option for anomaly detection.
Parameters
Without accounting for seasonality, we utilize three parameters:
When considering seasonality, we add these additional parameters:
How it works
To make predictions, we maximize p and q historical points. This means that we use \$max(p,q)+d\$ historical points to make a prediction.
The model produces a predicted value per timestamp; the upper and lower bands sit bound standard deviations around the prediction, and values that escape the band are anomalous.
In Dashboards
To use the sarima operator in a dashboard, apply the following function:
sarima( \
  ${promql}, \ (1)
  2, 1, 2, 0, 0, 0, 0, \
  ${bound}, \ (2)
  ${band} \ (3)
)| 1 | ${promql}: PromQL query to evaluate |
| 2 | ${bound}: Number of standard deviations (stdv): 1, 2, or 3 |
| 3 | ${band}: 4 = lower band, 5 = upper band, 6 = both upper and lower bands |
For the operator reference — syntax, parameters, and a validated example — see sarima in the PromQL documentation.
Limitations
-
If the evaluated metrics do not exhibit true seasonality, SARIMA may create incorrect (invalid) alerts, or mask valid alerting conditions.
-
SARIMA fits a model per input series; cost grows with the number of series. Aggregate before applying the function rather than banding every raw series.
-
Training needs \$max(p,q)+d\$ historical points — and \$(max(sp,sq)+sd)sm\$ when seasonal terms are set. The service fetches this history beyond the visible chart range; series with insufficient history are skipped silently rather than reported as errors.
-
High seasonal orders multiply both the history requirement and the fitting time.