Connect RUM and Traces
Kloudfuse RUM and APM can be linked together so that you can pivot from a frontend user session directly to the backend trace it generated.
Overview
When trace linking is enabled, every qualifying RUM resource and its corresponding backend trace share the same trace_id, which allows Kloudfuse to connect the two.
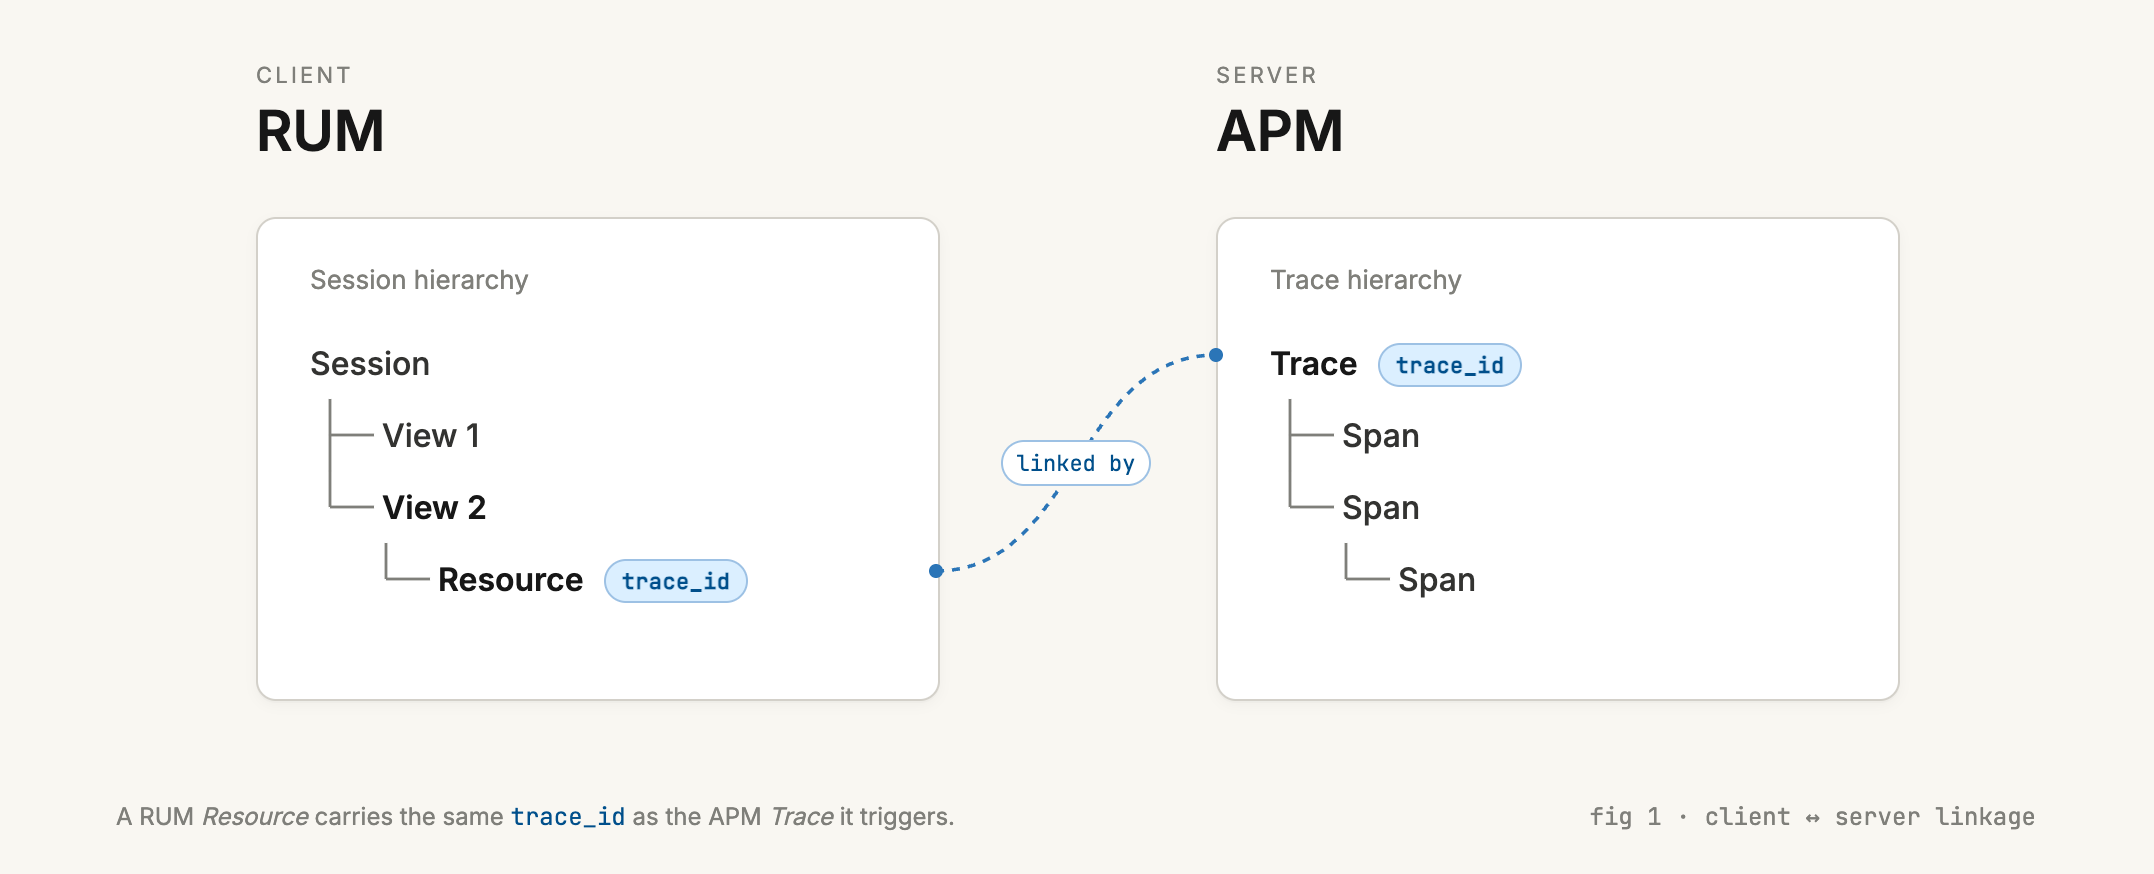
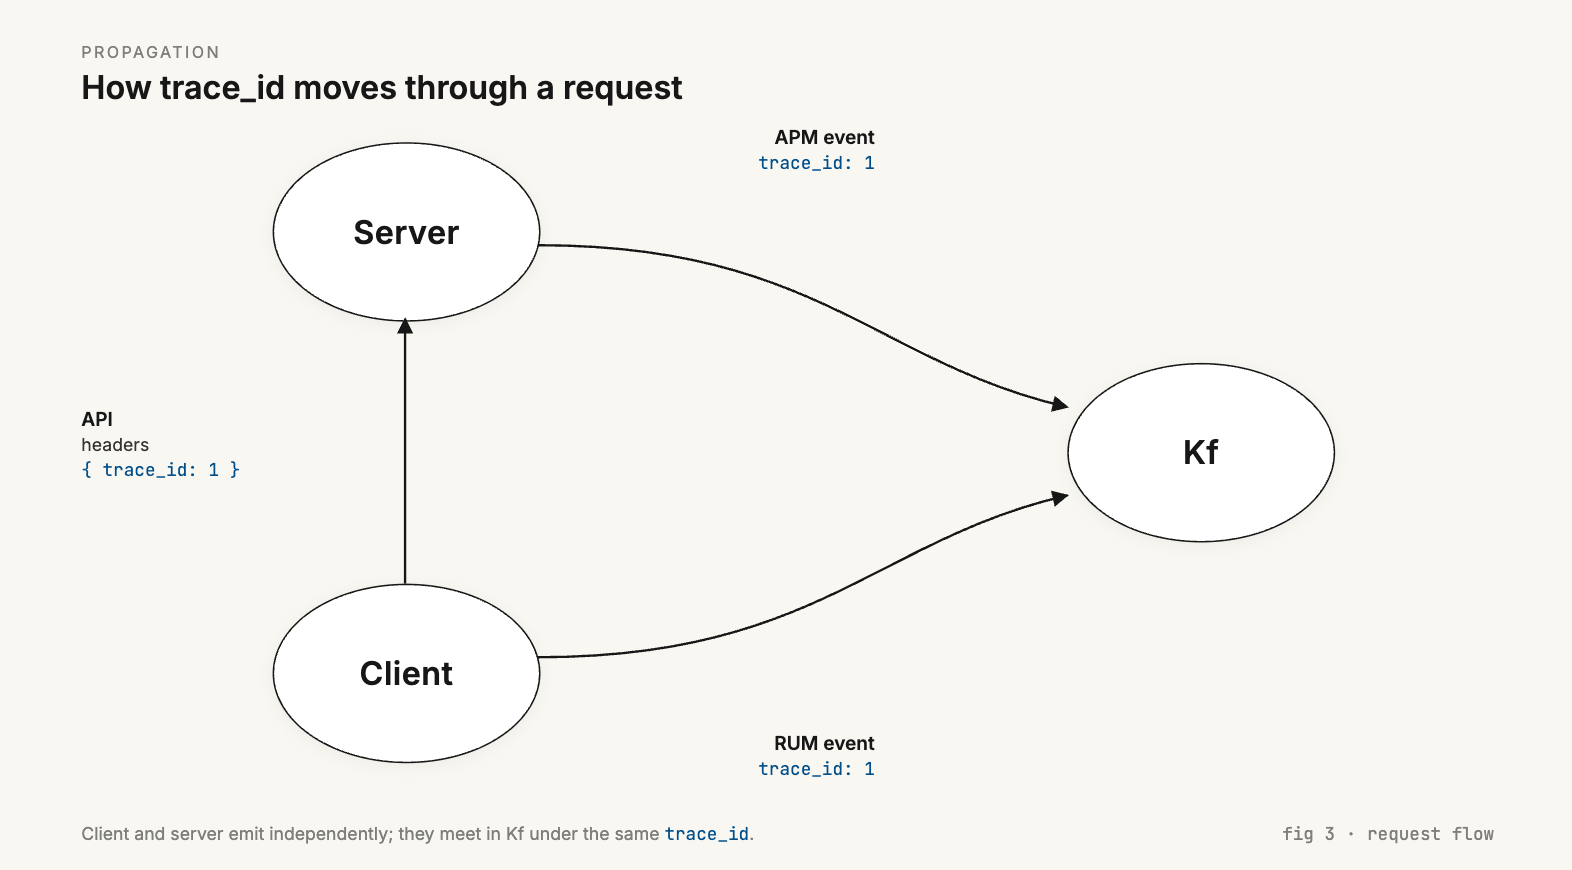
Under the hood, the RUM SDK injects standard tracing headers (such as W3C traceparent) onto qualifying outbound HTTP requests from the browser. The APM-instrumented backend reads those headers and continues the trace rather than starting a new one, so as long as both sides are configured correctly, RUM events and APM traces end up with matching trace_ids.
This gives you:
-
A View trace link on RUM resources, errors, and actions that opens the matching backend trace.
-
End-to-end visibility from a real user’s browser request through every backend service that handled it.
-
Faster root-cause analysis when a user-reported slowdown or error originates server-side.
Prerequisites
To link RUM events to APM traces, both sides must be configured:
-
Frontend: the Kloudfuse RUM Web SDK must be installed and initialized in your application. See RUM Setup for Web.
-
Backend: the services your RUM application calls must be instrumented with an APM Agent. See APM Overview.
-
Propagation: the backend tracer must be configured to read the W3C
tracecontext,b3ordatadogpropagation format.
Setup
Trace linking is configured in the Kloudfuse RUM SDK initialization for Web. Follow the base SDK setup in RUM Setup for Web, then enable distributed tracing as described below.
| Trace linking is currently supported only for the Web SDK. |
In your kfuseRumSDK.init({ … }) call, add the tracing configuration:
kfuseRumSDK.init({
    config: {
      applicationId: '<APPLICATION_ID>',
      clientToken: '<CLIENT_TOKEN>',
      service: '<APPLICATION_NAME>',
      proxy: 'https://<KLOUDFUSE_ENDPOINT>/ddrumproxy',
      env: 'production',
      version: '1.0.0',
      sessionSampleRate: 100,
      defaultPrivacyLevel: 'mask-user-input',
      enableSessionRecording: true,
      enableLogCollection: true,

      // RUM <-> APM linking
      allowedTracingUrls: [
        { match: /https:\/\/api\.example\.com/, propagatorTypes: ['tracecontext', 'datadog'] },
      ],
      traceSampleRate: 100,
    },
});For the full list of init options, see RUM Setup for Web.
Supported propagators
The Kloudfuse RUM SDK supports multiple trace context propagation formats. Configure the format(s) per URL using the propagatorTypes field on each entry in allowedTracingUrls. The backend tracer must be configured to read at least one of the formats the SDK is injecting for that request, otherwise the trace will not be linked.
| Propagator | Headers injected | Notes |
|---|---|---|
|
|
Datadog-native format. Use this when the backend is instrumented with a Datadog (or Datadog-compatible) APM tracer. |
|
|
W3C standard. Widely supported by OpenTelemetry and most modern APM tracers. |
|
|
Zipkin B3 single-header format. |
|
|
Zipkin B3 multi-header format. |
|
All of the above, simultaneously |
Default in SDK v6. Injects every supported format on each request so any compatible backend can pick the trace up. Costs a few extra request headers. |
View linked traces in the UI
Once trace linking is configured and traffic is flowing, Kloudfuse surfaces the link in two places.
From a RUM event to its trace
In RUM, open the resource list for your application. Resources whose backend request the SDK traced are flagged with a linked trace.
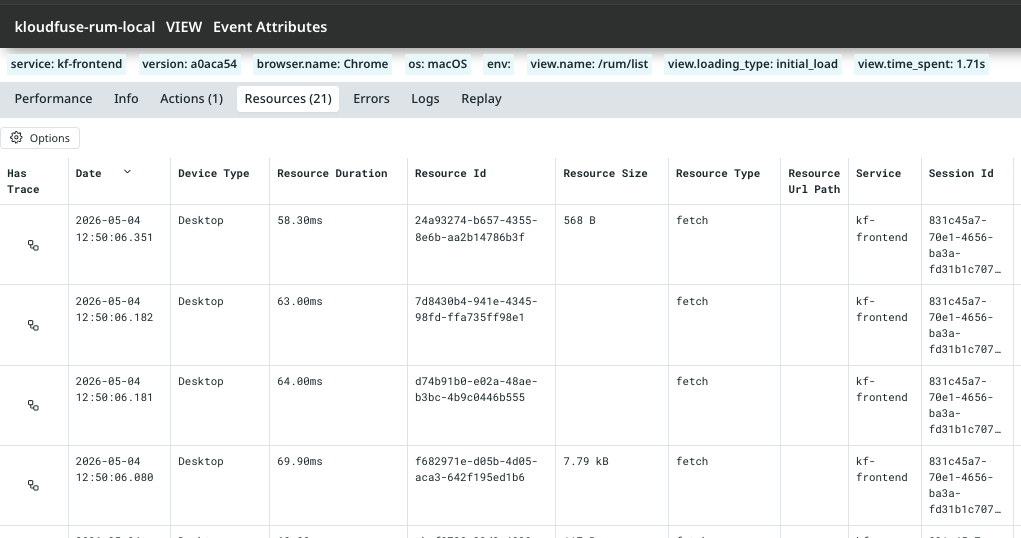
| Add the Has Trace column to the resource list to filter for resources that have a linked trace. |
Open a resource and select the Trace tab in the side panel to view its backend trace.
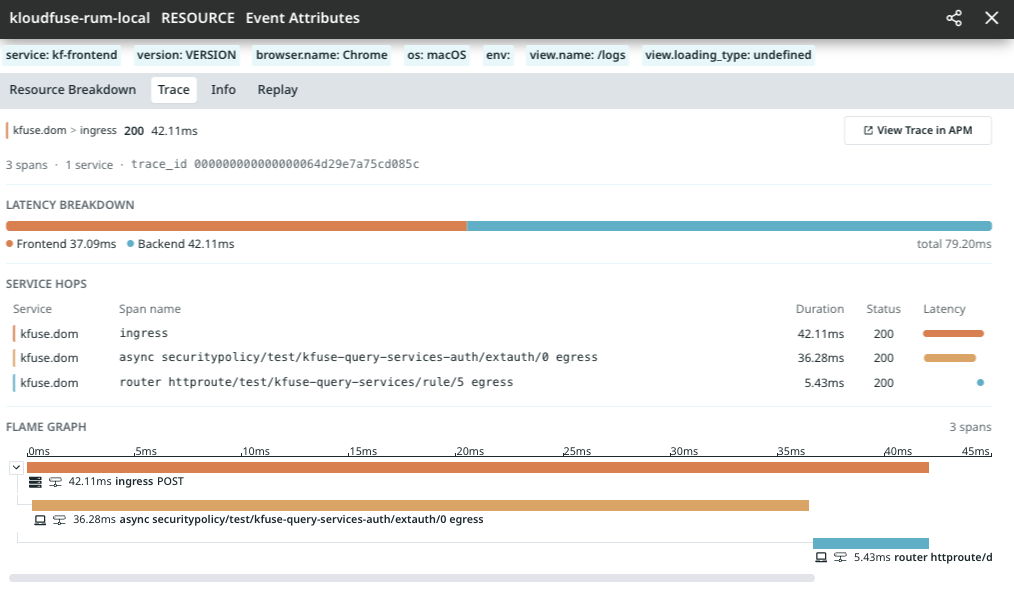
The Trace tab shows basic information about the linked backend trace, plus a link that opens the full trace in APM.
From a trace to its RUM session
On a trace whose root span was initiated by a RUM-instrumented client, the trace detail view exposes a RUM tab linking back to the originating session, view, and user.
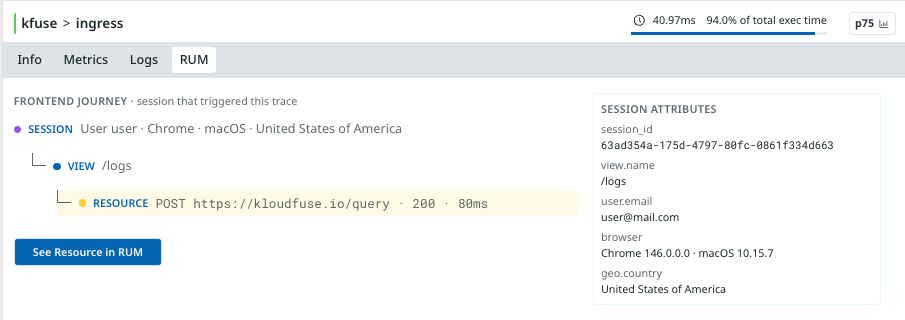
The tab shows the originating Session, View, and Resource in a nested hierarchy, each with its associated metadata. Click any of those labels to filter RUM by that value, or click See Resource in RUM to jump directly to the originating resource.
Troubleshooting
No "View trace" link appears on RUM events
-
Confirm the request URL matches an entry in the SDK’s
allowedTracingUrlsconfiguration. -
Confirm the backend service is APM-instrumented and reporting traces to the same Kloudfuse cluster.
-
Confirm the backend tracer is configured to read at least one of the propagation formats the SDK is injecting for that URL (see Supported propagators).
-
Check that the RUM session sample rate and the trace sample rate are both high enough that a given request is captured on both sides.
Browser blocks the tracing headers (CORS)
When the backend is on a different origin, the server must include the tracing header names in its Access-Control-Allow-Headers response. The exact header names depend on which propagators you have configured — see the Headers injected column in Supported propagators and add every header listed for each format you use.
Trace IDs do not match
-
Verify the backend tracer is configured to extract the same propagation format the SDK is injecting (see Supported propagators) rather than starting a new trace.
