Metrics Usage
Metrics Usage reports which of your metrics and labels are referenced by dashboards, alerts, and rules, and when each metric was last queried. Use it to find metrics that consume ingestion and cardinality budget while nothing depends on them, so you can shape or drop them without breaking existing content.
Access Metrics Usage
-
From the left navigation, click Metrics.
-
Select Metric Usage from the dropdown menu.
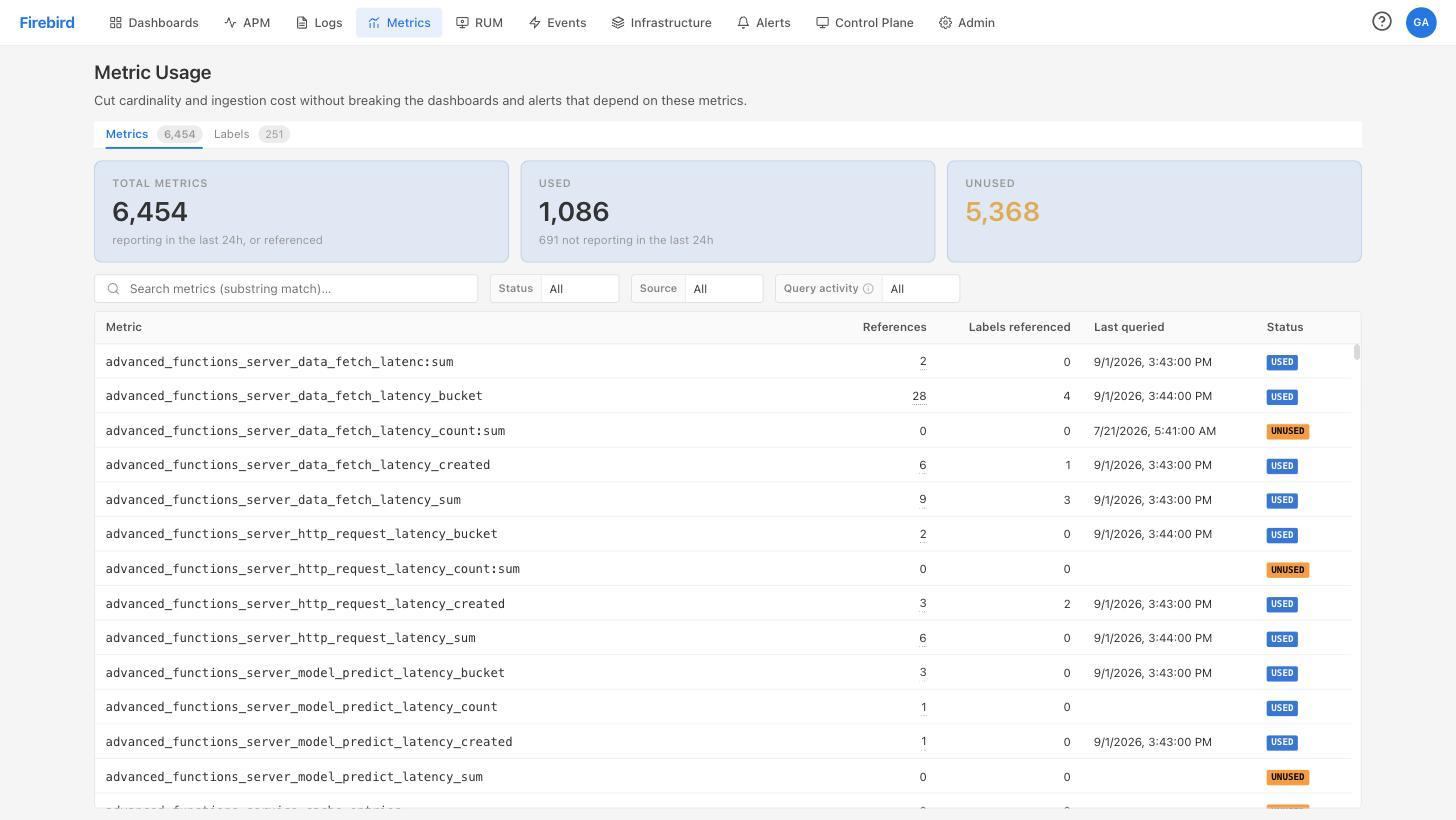
The page opens on the Metrics tab. The badge on each tab shows how many metrics and labels Kloudfuse is tracking.
Summary tiles
Three tiles summarize the metrics currently in view. Used and Unused always add up to the value in the first tile.
| Tile | Description |
|---|---|
Total metrics |
The union of two sets: metrics that reported in the last 24 hours, and metrics referenced by a dashboard, alert, or rule. A metric in both is counted once, so a referenced metric that has stopped reporting still appears here. |
Used |
Metrics that at least one dashboard, alert, or rule references. When some of them are no longer reporting, a note below the value tells you how many. Those references have outlived the metric they point to. |
Unused |
Metrics that no dashboard, alert, or rule references. These are your candidates for shaping or dropping. |
The tiles describe the rows currently on screen, not your whole estate. Applying a filter narrows all three together, and the first tile changes to Matching metrics, showing the filtered count against the unfiltered total.
Metrics tab
The Metrics tab lists one row per metric. Every column sorts.
| Column | Description |
|---|---|
Metric |
The metric name. |
References |
The number of distinct dashboards, alerts, and rules that use this metric. Hover over a non-zero count to see the breakdown by source. |
Labels referenced |
How many of the metric’s labels appear in a query, either as a matcher or in a group-by clause. |
Last queried |
When someone last ran a query against this metric. An empty value means Kloudfuse has no record of a query. |
Status |
|
Reference sources
Kloudfuse scans six kinds of content for metric references.
| Source | Where the reference comes from | Opens from the drawer |
|---|---|---|
Dashboard |
A panel query on any dashboard |
Yes |
Alert |
An alert rule condition |
Yes |
SLO |
An SLO definition of any type |
Yes |
Derived metric |
A derived metric definition |
Yes |
Metric shaping |
A metric shaping rule |
Yes |
Recording rule |
A recording rule expression |
No. Recording rules are defined in |
Inspect the references to a metric
Click any row to open the reference drawer. The drawer groups references by source and counts each group, so you can see what breaks before you drop a metric.
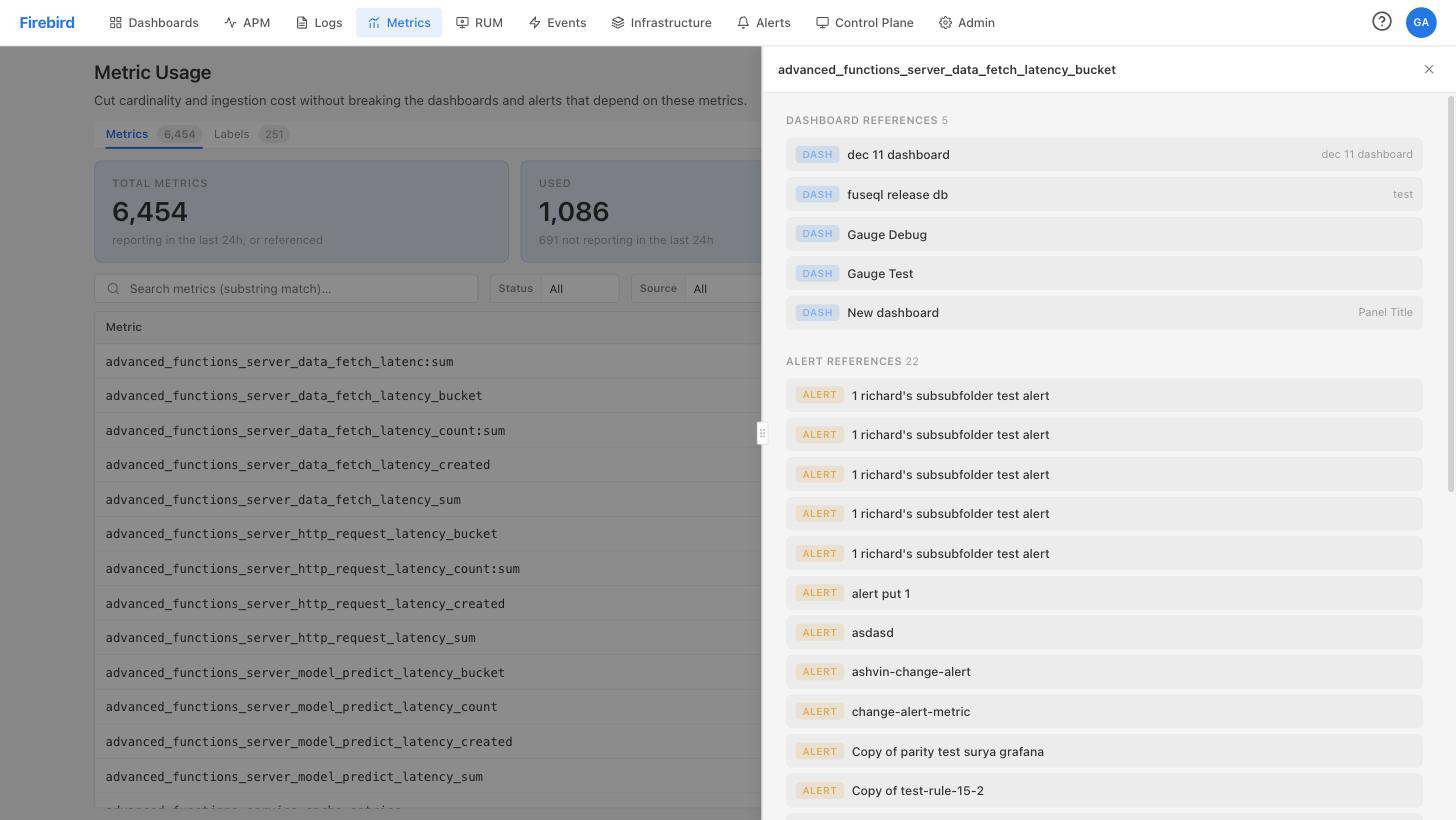
Click any dashboard, alert, SLO, derived metric, or metric shaping entry to open it. Recording rule entries are listed, but are not links.
Filter the metric list
Use the search field for a substring match on the metric name, then narrow further with three filters.
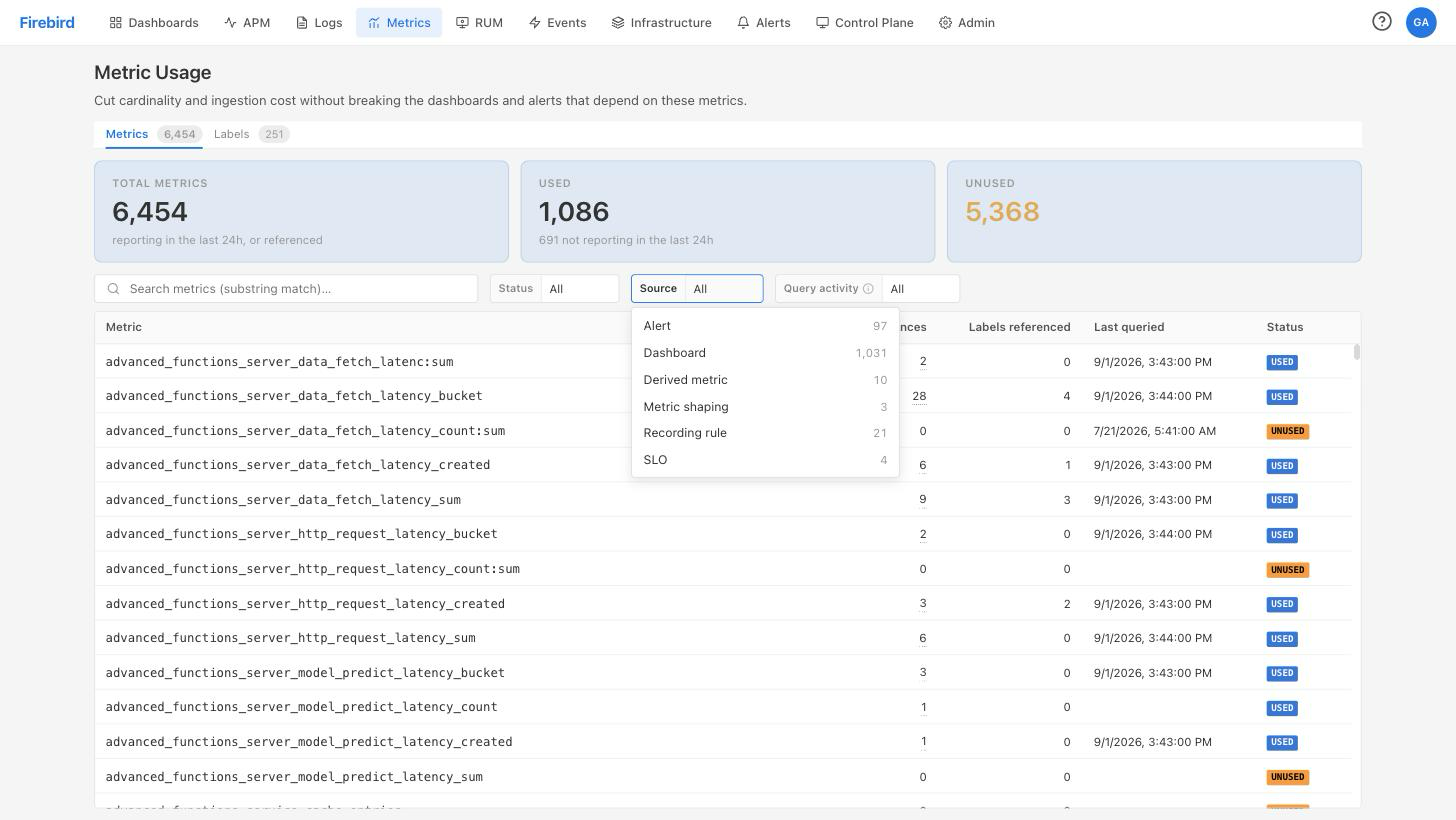
Source
Restrict the list to metrics referenced by one or more source types. The dropdown lists only the sources present in your installation, each with its reference count, and you can select several at once.
Query activity
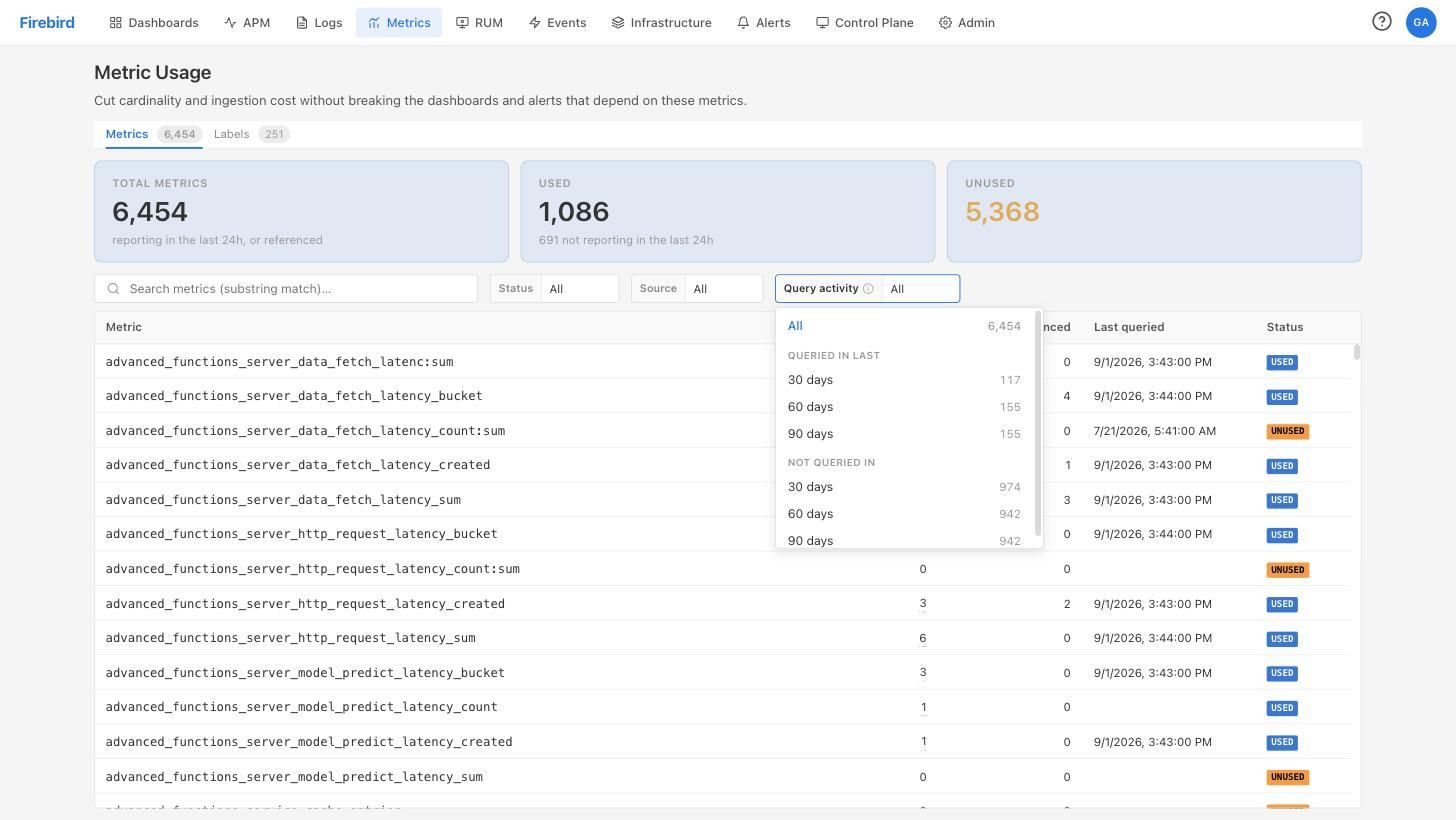
Filter on when a metric was last queried, in either direction, over a 30-, 60-, or 90-day window.
-
Queried in last covers every metric queried inside the window, including metrics that nothing references.
-
Not queried in covers only referenced metrics that nobody queried inside the window. This is the cleanup view: content still points at these metrics, but no one is looking at them.
Two filter combinations are mutually exclusive. Kloudfuse disables the conflicting control rather than returning an empty list:
-
Choosing a Not queried in window disables Status, because that option only covers referenced metrics, so every result is already
USED. -
Choosing Unused under Status disables Source, because unused metrics have no references and therefore no source to filter by.
Labels tab
The Labels tab reports usage per label rather than per metric, which tells you which labels are worth keeping when you shape a metric down.
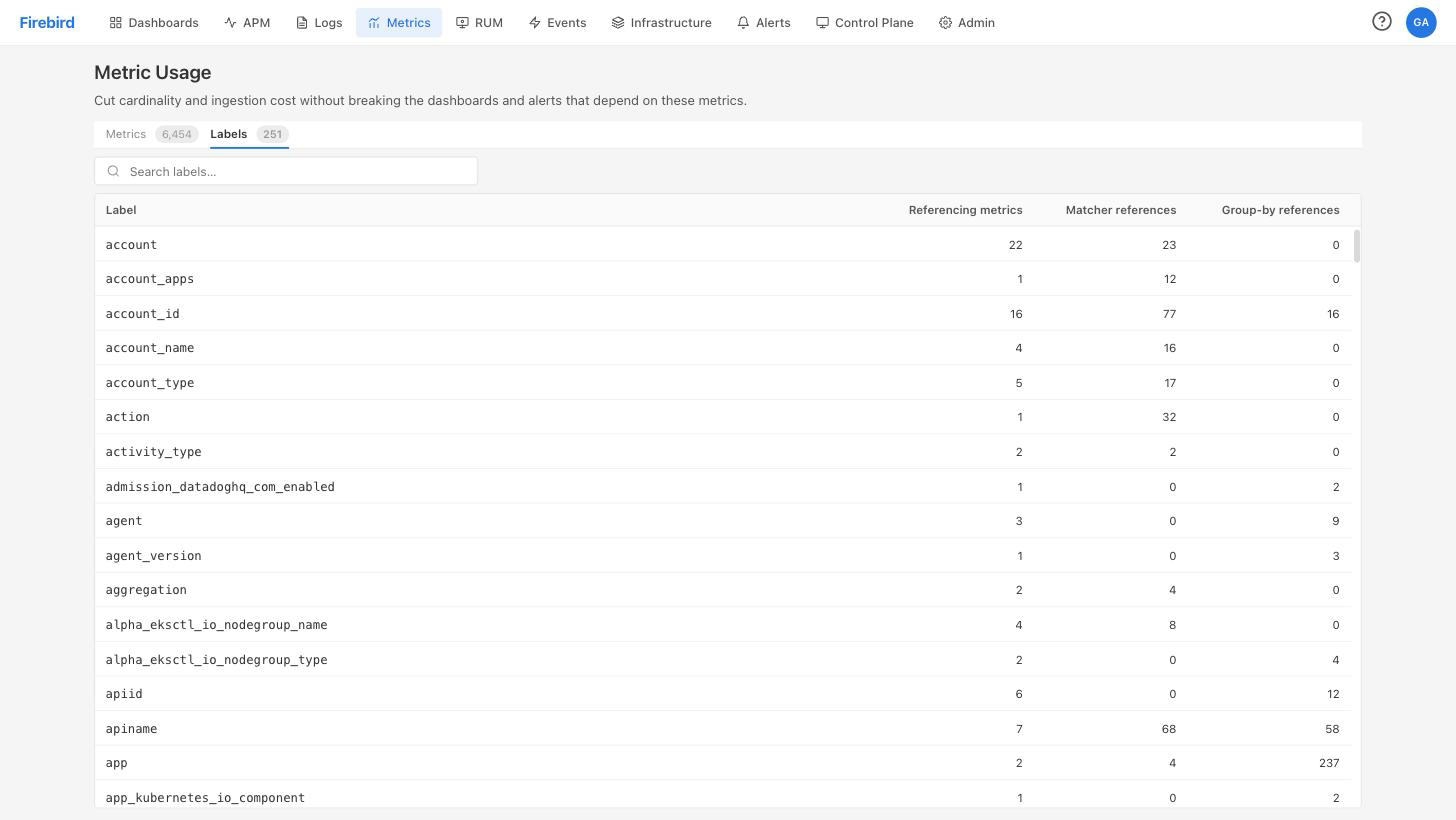
| Column | Description |
|---|---|
Label |
The label name. |
Referencing metrics |
How many distinct metrics carry this label in a query. |
Matcher references |
How many queries filter on this label. |
Group-by references |
How many queries group by this label. |
A label with a high metric count but no matcher or group-by references is a strong candidate for dropping in a metric shaping rule.
Identify metrics you can safely drop
-
Open the Metrics tab.
-
Set Status to Unused. Nothing references the metrics that remain.
-
Check Last queried on each candidate. A metric with no references but recent query activity is still in ad hoc use, so leave it alone.
-
Set Status back to All, then set Query activity to Not queried in 90 days. This surfaces the opposite case: metrics that content still references, but that nobody has looked at in a quarter.
-
For each metric you intend to drop, click its row and read the reference drawer first.
-
Drop or reduce the metric with a metric shaping rule.
How Kloudfuse determines usage
Two time windows govern what this page reports.
Reporting metrics. The metric list is built from the metrics reporting over the last 24 hours. A metric that stopped reporting more than 24 hours ago appears only when something still references it, and it then counts toward the not-reporting note on the Used tile.
Query activity. Kloudfuse retains query logs for approximately 90 days. An empty Last queried value therefore means either that nobody has queried the metric, or that they last queried it more than 90 days ago. For the same reason, the Query activity filter offers no never-queried option; Not queried in 90 days is the equivalent.
References. Counts are per referencing object, not per query. A rule that mentions a metric in several of its queries contributes a single reference.
Limitations
-
Only saved content creates a reference. A metric read any other way — from an external Grafana, or by a script hitting the API — shows up under Last queried, but never as a reference.
-
Recording rule references are listed with their names, but cannot be opened from the drawer, because recording rules are defined in
custom_values.yamlrather than in the UI. To check one, find the matching entry underrulemanager.rulesin your values file. See Recording Rules. -
The status of a metric reflects references only. A metric with no references may still be actively queried, so check Last queried before dropping anything.