Kubernetes Integration Architecture
Kloudfuse collects metrics, logs, traces, and events from Kubernetes clusters using one or more collection agents. This page explains the overall architecture, how each agent works, and how to choose the right agent for your environment.
Overview
Every Kloudfuse-compatible Kubernetes agent runs inside the cluster as a DaemonSet or Deployment. Each agent scrapes or receives telemetry from the cluster control plane and from application pods, then forwards the data to the Kloudfuse ingester over HTTPS.
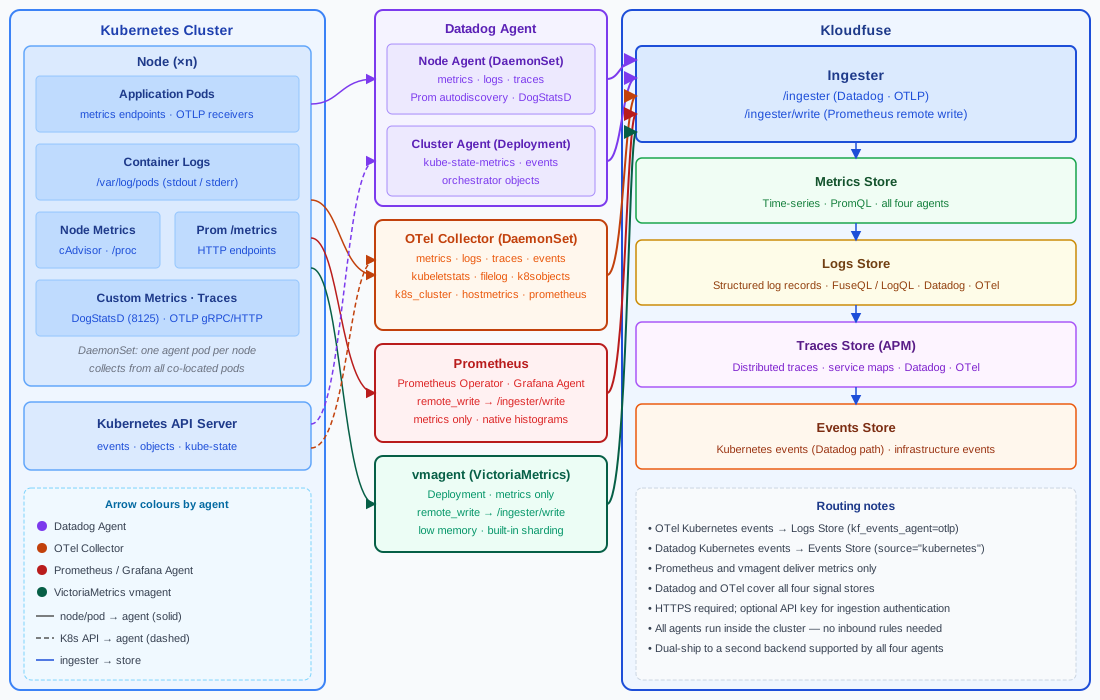
The four supported agents follow two collection families:
-
Datadog Agent family — collects metrics, logs, traces, Kubernetes events, and infrastructure objects using the Datadog wire protocol.
-
OpenTelemetry / Prometheus family — collects metrics (and optionally logs, traces, and events) using open standards: OTLP HTTP, and Prometheus remote write.
You can run multiple agents in the same cluster. A common setup is the Datadog Agent for full-stack coverage (including APM and Kubernetes events) combined with Prometheus remote write for metrics from existing Prometheus Operator deployments.
Collection Agents
Datadog Agent
The Datadog Agent deploys as two components:
-
Node Agent (DaemonSet) — one pod per node. Collects container metrics (via the container runtime socket), container logs (from
/var/log/pods), Prometheus/OpenMetrics endpoints (via Autodiscovery), APM traces (via DogStatsD on port 8126), and process information. -
Cluster Agent (Deployment) — one pod per cluster. Reads the Kubernetes API server to collect kube-state-metrics, orchestrator objects (Deployments, ReplicaSets, DaemonSets, StatefulSets, Nodes, Pods, Services), and Kubernetes events.
Data flows from each Node Agent to the Cluster Agent for aggregation, then both forward to the Kloudfuse ingester.
| Signal | Source | Kloudfuse store |
|---|---|---|
Node metrics |
cAdvisor, |
Metrics |
Kube-state metrics |
Kubernetes API (via Cluster Agent) |
Metrics |
Container logs |
|
Logs |
APM traces |
DogStatsD / trace listener on port 8126 |
Traces (APM) |
Kubernetes events |
Kubernetes API (via Cluster Agent) |
Events |
Orchestrator objects |
Kubernetes API (via Cluster Agent) |
Events / Infrastructure |
Custom metrics |
DogStatsD UDP on port 8125 |
Metrics |
The Datadog Agent uses Autodiscovery to find Prometheus endpoints exposed by application pods.
Annotate any pod with prometheus.io/scrape: "true" and the node agent will scrape and forward those metrics automatically.
See Datadog Kubernetes Integration for installation and configuration details.
OpenTelemetry Collector
The OTel Collector Contrib distribution deploys as a DaemonSet. It uses receiver pipelines to collect multiple signal types and forwards them to Kloudfuse over OTLP HTTP.
| Signal | Receiver | Kloudfuse store |
|---|---|---|
Node and pod metrics |
|
Metrics |
Cluster-level metrics |
|
Metrics |
Container logs |
|
Logs |
OTLP traces |
|
Traces (APM) |
Kubernetes events |
|
Logs (tagged |
Host metrics |
|
Metrics |
Prometheus endpoints |
|
Metrics |
Kubernetes events collected by the OTel Collector are stored in the Kloudfuse Logs store, tagged kf_events_agent=otlp.
This differs from the Datadog Agent path, where Kubernetes events go to the Events store (source="kubernetes").
|
The collector is configured via a values.yaml passed to the opentelemetry-collector Helm chart.
Multiple pipelines can run in parallel — for example, a metrics pipeline and a separate logs pipeline with different processors.
See OTel Kubernetes Integration for installation and configuration details.
Prometheus / Grafana Agent
If your cluster already runs Prometheus (standalone, via Prometheus Operator, or kube-prometheus-stack), you can forward metrics to Kloudfuse without deploying an additional agent.
Add a remote_write block pointing to https://<kloudfuse-hostname>/ingester/write.
Grafana Agent is a lighter alternative that scrapes the same scrape_configs format as Prometheus and writes to one or more remote write endpoints.
It can run as a DaemonSet (for per-node scraping) or as a single Deployment.
| Signal | Source | Kloudfuse store |
|---|---|---|
Node and pod metrics |
|
Metrics |
Application metrics |
Any Prometheus-compatible |
Metrics |
Native histograms |
Prometheus 2.40+ targets |
Metrics |
This path is metrics-only. For logs, traces, and Kubernetes events, pair with the OTel Collector or Datadog Agent.
See Prometheus Remote Write Integration for configuration details.
VictoriaMetrics Agent
vmagent is a drop-in alternative to a Prometheus server for metric collection.
It scrapes the same scrape_configs format as Prometheus and writes to Kloudfuse via Prometheus remote write.
It has lower memory usage than a full Prometheus server and supports built-in sharding for large clusters.
| Signal | Source | Kloudfuse store |
|---|---|---|
Node and pod metrics |
Any Prometheus-compatible endpoint |
Metrics |
Application metrics |
Static targets or Kubernetes service discovery |
Metrics |
Like the Prometheus path, vmagent is metrics-only.
See VictoriaMetrics Integration for installation and configuration details.
Agent Comparison
| Capability | Datadog Agent | OTel Collector | Prometheus / Grafana Agent | vmagent |
|---|---|---|---|---|
Cluster metrics (kube-state) |
✓ |
✓ |
✓ (with kube-state-metrics) |
✓ (with kube-state-metrics) |
Node / pod metrics |
✓ |
✓ |
✓ |
✓ |
Container logs |
✓ |
✓ |
— |
— |
APM traces |
✓ |
✓ (OTLP ingest) |
— |
— |
Kubernetes events |
✓ (Events store) |
✓ (Logs store) |
— |
— |
Prometheus scraping |
✓ (Autodiscovery) |
✓ ( |
✓ |
✓ |
Native histograms |
— |
✓ |
✓ (Prometheus 2.40+) |
— |
Dual shipping |
✓ |
✓ (multiple exporters) |
✓ (multiple remote writes) |
✓ (multiple remote writes) |
Data Flow
All agents follow the same high-level flow:
-
The agent (DaemonSet pod or Deployment) runs inside the cluster alongside application pods.
-
The agent collects telemetry from local node sources (cAdvisor,
/proc,/var/log/pods) and from the Kubernetes API server. -
Application pods expose telemetry directly to the agent via DogStatsD (Datadog), OTLP gRPC/HTTP (OTel), or Prometheus
/metricsendpoints. -
The agent batches and compresses the collected data.
-
Data is delivered to the Kloudfuse ingester endpoint over HTTPS —
https://<kloudfuse-hostname>/ingesterfor Datadog and OTel protocols, orhttps://<kloudfuse-hostname>/ingester/writefor Prometheus remote write. -
The Kloudfuse ingester routes each signal to the appropriate store: metrics time-series store, log store, trace store, or events store.
Choosing an Agent
| If you need… | Use… |
|---|---|
Metrics, logs, traces, and Kubernetes events from a single agent |
|
Open-standards collection (OTLP) with full signal coverage |
|
Metrics only, and Prometheus is already running in the cluster |
|
Metrics only, with low memory footprint and no existing Prometheus |
|
Full signal coverage plus an existing Prometheus stack |
Datadog Agent or OTel Collector for logs/traces/events + Prometheus remote write for metrics |