Logs Explorer Architecture
The Logs Explorer is one screen for searching, aggregating, and clustering every log line Kloudfuse has ingested. This page explains how a log line gets there, what Kloudfuse extracts from it along the way, how the Explorer’s UI is organized, and how a search actually reaches the stored data.
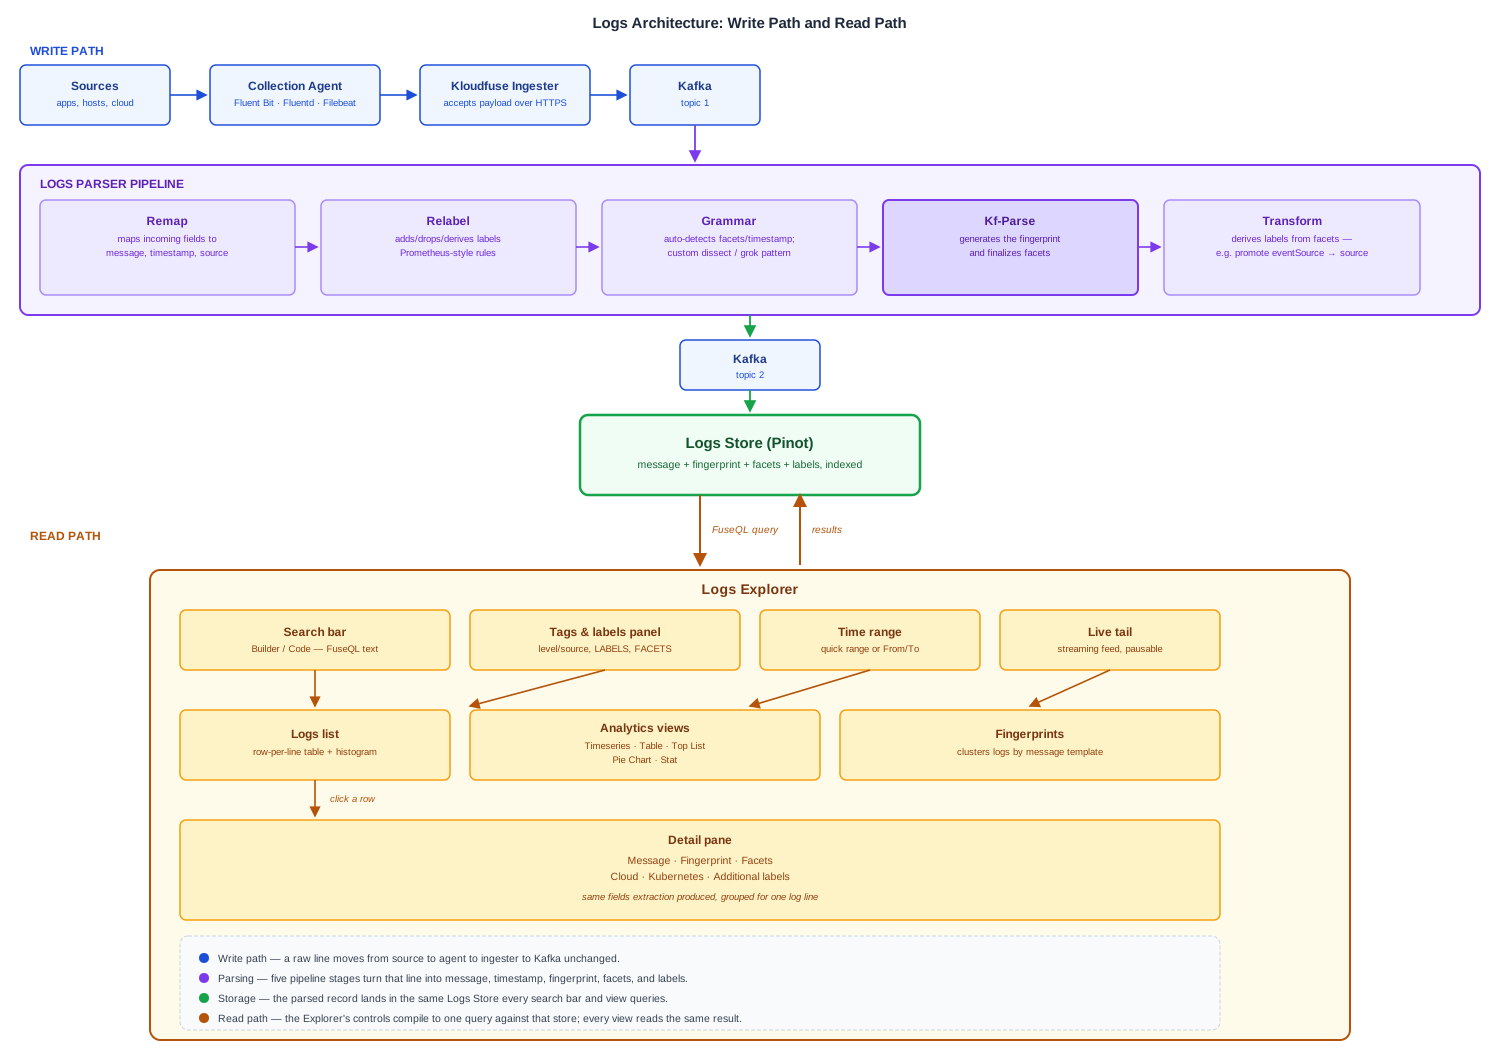
How a log line reaches the Logs Store
Getting logs into Kloudfuse in the first place — which collection agent to run, which ingester endpoint it talks to, how it’s deployed — is its own topic; see Kubernetes Integration Architecture for the Kubernetes collection agents and Log Forwarding Architecture for the dedicated log forwarders (Fluent Bit, Fluentd, Filebeat) and the deployment patterns each suits. This page picks up once a log payload has arrived at the ingester.
-
Ingester → Kafka. The ingester accepts the raw log payload over HTTPS and writes it to a Kafka topic, decoupling ingestion from parsing.
-
Logs Parser. A dedicated service reads each payload off Kafka and unmarshalls it into JSON before running it through a pipeline of stages:
- Remap
-
Maps fields from the incoming payload — in whatever shape your agent sends (JSON, msgpack, proto) — onto Kloudfuse’s internal fields: message, timestamp, source, and initial labels/facets. Fully configurable per agent.
- Relabel
-
Adds, drops, replaces, or derives labels from what Remap extracted, using Prometheus-style relabel rules.
- Grammar
-
Kloudfuse auto-detects facets and a timestamp from the message using a heuristic. If that heuristic isn’t accurate enough for a given log format, define a custom dissect (tokenizer) or grok (named-regex) pattern here to extract fields precisely.
- Kf-Parse
-
Internal and not configurable — this is where Kloudfuse generates the fingerprint (the message’s template, with variable parts replaced by placeholders) and finalizes the facets extracted from it.
- Transform
-
Derives labels from the facets extracted above — for example, promoting a facet like
eventSourceto a label namedsource.
-
Kafka → Logs Store. The fully parsed record — message, timestamp, fingerprint, facets, and labels — is written to a second Kafka topic and consumed into the Logs Store (Pinot), where it becomes searchable.
See Log Parsing Configuration for the full configuration reference (remap, relabel, grammar, and transform syntax with examples), and Log Timestamp Handling for how Kloudfuse picks and validates a log’s timestamp specifically.
Facets, labels, and tags — and why the distinction matters for search
Three kinds of metadata end up attached to a stored log line, and which one a field is determines how you filter on it:
- Facets
-
Fields Kloudfuse extracted from the message itself — either automatically (the Grammar/Kf-Parse stages above) or by a custom dissect/grok pattern you defined. In the search bar these are prefixed with
@(for example@status). - Labels
-
Structured metadata attached to the log at collection time — Kubernetes pod/namespace/cluster, cloud region/zone/account, and any custom labels your agent adds. The Explorer groups these under Cloud, Kubernetes, and Additional in the Tags & labels panel.
- Tags
-
The catch-all extra key/value pairs shown on an individual log’s detail pane alongside its Labels — see Detail pane below.
This is also why a log’s Kubernetes and Cloud fields line up with the same fields on a Pod’s own detail pane elsewhere in Kloudfuse: both are populated from the same collection-time labels, which is what lets you correlate a log line back to the exact pod, node, or cloud resource that produced it.
Explorer layout: sidebar, search bar, and view tabs
Click Logs in the top navigation to open the Explorer. Three things work together to define what the main pane shows:
Left sidebar: Tags & labels panel
The sidebar is a set of collapsible groups you use to narrow the current query without typing:
-
level and source sit at the top, ungrouped, because they’re the fields almost every search starts from — a checkbox per value, with a live count.
-
LABELS groups the rest by where they came from: Cloud (availability zone, provider, region, and so on), Kubernetes (cluster, namespace, pod, container), and Additional (every other label your sources set — this list is generated from your own data, so it differs by environment).
-
FACETS lists auto-extracted and custom facets, starting with Recents. The full catalog of every facet Kloudfuse knows about — which favorite group it’s in, which folder it’s organized under — is managed on its own Facets page (Logs menu → Facets).
Checking a value here and typing the equivalent filter in the search bar are the same operation — each stays in sync with the other.
Search bar
Accepts a query directly: plain terms, quoted substrings, and the full comparison/regex/facet operator set — see Logs Search Syntax for the complete reference. Two modes sit above it:
-
Builder — the default; the bar above builds a structured filter as you type, with autocomplete for field names and an operator cheat-sheet.
-
Code — a raw FuseQL query editor, for queries more complex than the Builder’s autocomplete is meant for.
View tabs
The tab strip above the query (Logs · Timeseries · Table · Top List · Pie Chart · Stat · Fingerprints) doesn’t change what you searched for — it changes how the same result set is rendered:
- Logs
-
The default — a raw row-per-log-line table (Timestamp, Level, Source, Message) plus a histogram of volume over time.
- Timeseries / Table / Top List / Pie Chart / Stat
-
Aggregation views, all sharing one query builder (
+ Query,+ Formula,Show count of … by … roll up every …) — see Logs Analytics for how to build an aggregation and what each view is best for. - Fingerprints
-
Clusters log lines by their fingerprint (the same template pattern computed during Kf-Parse) and lists each cluster’s source, pattern, occurrence count, and trend — the fastest way to see what kinds of lines a noisy, high-volume source is actually producing, without reading them one at a time.
Detail pane
Click any row in the Logs view to open a detail pane for that specific log line:
- Message
-
The raw log line, with a Show in context control to jump to the surrounding lines from the same source.
- Fingerprint
-
This line’s template — the same pattern format used to cluster it in the Fingerprints view, with variable segments replaced by placeholders (
<v_0>,<v_1>, …). - Facets
-
The fields Kloudfuse extracted from this specific message (see Facets, labels, and tags above) — for example a parsed duration, status code, or count.
- Cloud / Kubernetes
-
The structured labels attached at collection time — the same fields the sidebar’s Cloud and Kubernetes groups are built from.
- Additional labels
-
Every other label attached to this log line.
A search box at the top of the pane filters a long Facets/Labels list by name.
How a search reaches the data
Whatever you build in the Builder, type in Code, or check in the sidebar compiles to the same thing: a FuseQL query against the Logs Store. The Store already has every facet and label indexed, so filtering on level=error or @status==500 doesn’t require scanning raw messages — only a term search or a substring/regex match ("error text", msg=~"timeout.*") touches the message text itself. This is why narrowing by a facet or label first, then adding a text search, is generally faster than a text search alone.
The same query also drives the Logs 200 / Total docs / Scanned counters above the results table: Total docs is how many records exist in the time range before your filter, Scanned is how many the query engine had to read to answer it, and the row count is what’s actually shown.
Live tail
Live tail (opened from the time range picker) replaces the fixed time range with a streaming feed: new matching logs append as they arrive, and a pause control freezes the stream without losing your filter. It uses the same search bar and sidebar as every other view — the only thing that changes is the time dimension.