Infrastructure Explorer Architecture
The Infrastructure Explorer is a single screen for browsing every Kubernetes object Kloudfuse knows about, across every cluster you monitor. This page explains where that data comes from, how the left sidebar organizes it by resource kind, how those kinds relate to each other, how to narrow a table down, and the detail-pane layout shared by all of them.
How Kubernetes objects reach the Explorer
The Explorer’s tables and detail panes are built from four kinds of data, each collected differently:
| What you see | Where it comes from | Kloudfuse store |
|---|---|---|
Object tables and the Details/YAML tabs (Pods, Deployments, Services, RBAC objects, and so on) |
The Kubernetes API server, read by your collection agent’s orchestrator-object component |
Infrastructure / Events |
The Metrics tab (CPU, memory, network) |
|
Metrics |
The Logs tab |
Container log files, tailed by your collection agent and tagged with pod/container/namespace labels |
Logs |
The Events tab |
The Kubernetes Events API |
Events, or Logs tagged |
Which agent collects which signal, and the exact receiver or component involved, depends on whether you’re running the Datadog Agent, the OTel Collector, or a metrics-only agent like Prometheus or vmagent — see Kubernetes Integration Architecture for the full agent-by-agent breakdown. Whatever the source, every signal is tagged with the same identifying labels (kube_cluster_name, kube_namespace, pod_name, node_name, and so on), which is what lets the Explorer correlate an object’s manifest, metrics, logs, and events into one detail pane.
Resource taxonomy: the left sidebar
The top of the Infrastructure Explorer’s left sidebar is a resource-kind picker. Selecting a kind sets what the main table shows — every instance of that Kubernetes kind, across every cluster you have access to. It has two tiers: four kinds sit permanently at the top, ungrouped, because they’re the ones most people reach for first; the rest are grouped into six collapsible categories. Expand a category to pick a specific kind:
- Pods
-
Filter on pod name; the table returns Status, QoS, Cluster, Namespace, Age, Restarts, Ready/Total, % Ready, CPU, and Memory. See Kubernetes Infrastructure: Pods.
- Clusters
-
Filter on cluster name; the table returns Age, Versions, Nodes, CPU Total/Allocable/Used, Memory Total/Allocable/Used, and Pods Total/In Use/% Usage. See Kubernetes Infrastructure : Clusters.
- Namespaces
-
Filter on namespace name; the table returns Cluster, Status, Age, CPU/Memory usage, and Pods/Deployments/DaemonSets/StatefulSets/CronJobs counts. See Kubernetes Infrastructure: Namespaces.
- Nodes
-
Filter on node name; the table returns Cluster, Status, Schedulable, Age, Kubelet version, Roles, and CPU/Memory capacity. See Kubernetes Infrastructure: Nodes.
- Workloads
-
Deployments, DaemonSets, StatefulSets, ReplicaSets, Jobs, and CronJobs.
- Deployments
-
Cluster, Namespace, Strategy, Age, Current, Desired, Up-to-date, and Available.
- DaemonSets
-
Cluster, Namespace, Status, Selectors, Strategy, and Age.
- StatefulSets
-
Cluster, Namespace, Service, Selectors, Pod Policy, Update Strategy, Age, Current, and Desired.
- ReplicaSets
-
Cluster, Namespace, Deployment, Age, Current, Desired, and Ready.
- Jobs
-
Cluster, Namespace, Status, Completions, Parallelism, Backoff Limit, Age, Duration, and Kubernetes Labels.
- CronJobs
-
Cluster, Namespace, Age, Schedule, Suspend, Active Jobs, and Kubernetes Labels.
- Network
-
Services, Ingresses, and IngressClasses.
- Services
-
Service, Age, Type, Cluster IP, External IPs, and Ports.
- Ingresses
-
Ingress, Cluster, Namespace, Class, Rules, and Age.
- IngressClasses
-
Cluster, Controller, and Age.
- Storage
-
PersistentVolumeClaims, PersistentVolumes, and StorageClasses.
- PersistentVolumeClaims
-
Cluster, Namespace, Class, Phase, Persistent Volume, Access Modes, Age, Capacity Requests, and Capacity.
- PersistentVolumes
-
Cluster, Phase, Class, Type, Access Modes, Reclaim Policy, Age, and Capacity.
- StorageClasses
-
Cluster, Provisioner, Reclaim Policy, and Age.
- Access Control
-
ServiceAccounts, ClusterRoles, Roles, ClusterRoleBindings, and RoleBindings.
- ServiceAccounts
-
Cluster, Namespace, Automount Token, Secret Names, and Age.
- ClusterRoles
-
Cluster, Rules, and Age.
- Roles
-
Cluster, Namespace, Rules, and Age.
- ClusterRoleBindings
-
Cluster, Role, Subjects, and Age.
- RoleBindings
-
Cluster, Namespace, Role, Subjects, and Age.
- Configuration
-
ConfigMaps.
- ConfigMaps
-
Cluster, Namespace, Data keys, and Age.
- Gateway API
-
Gateways, GatewayClasses, and HTTPRoutes — for clusters running a Gateway API implementation.
- Gateways
-
Cluster, Namespace, Class, Addresses, and Age.
- GatewayClasses
-
Cluster, Controller, and Age.
- HTTPRoutes
-
Cluster, Namespace, Hostnames, and Age.
This list mirrors the actual Kubernetes API: every entry is a real Kubernetes kind, and the six category headers (Workloads, Network, Storage, Access Control, Configuration, Gateway API) are Kloudfuse’s grouping of those kinds, not a Kubernetes concept. If your cluster doesn’t run any objects of a given kind — no Gateway resources, for example, if you haven’t installed a Gateway API implementation — that kind’s table is simply empty; it isn’t hidden from the sidebar.
Rows in most tables link back to related objects: a Pod row links to its Cluster and Namespace, so you can pivot from "this pod" to "everything else in this namespace" without re-filtering by hand.
Click any row, in any of these tables, to open a detail pane for that specific object — see The resource detail pane below. Clicking a Service, for example, opens the same Details/YAML/Metrics/Logs/Events tabs as a Pod, but with content specific to a Service: Details shows its Type, Cluster IP, External IP, and Ports rather than a Pod’s status or QoS, and Metrics shows CPU/memory requests, limits, and usage broken down by the Pods behind the Service, plus network rate and errors — because a Service has no compute of its own to report.
How the resources relate to each other
The sidebar groups resource kinds by function, but Kubernetes objects also relate to each other structurally — a Deployment owns the ReplicaSet that owns your Pods, a Service selects Pods by label, a PersistentVolumeClaim binds to a PersistentVolume. Kloudfuse doesn’t invent these relationships; it surfaces the ones already defined by the Kubernetes API. The diagram below maps the resource kinds in the taxonomy above to how they actually reference or own one another:
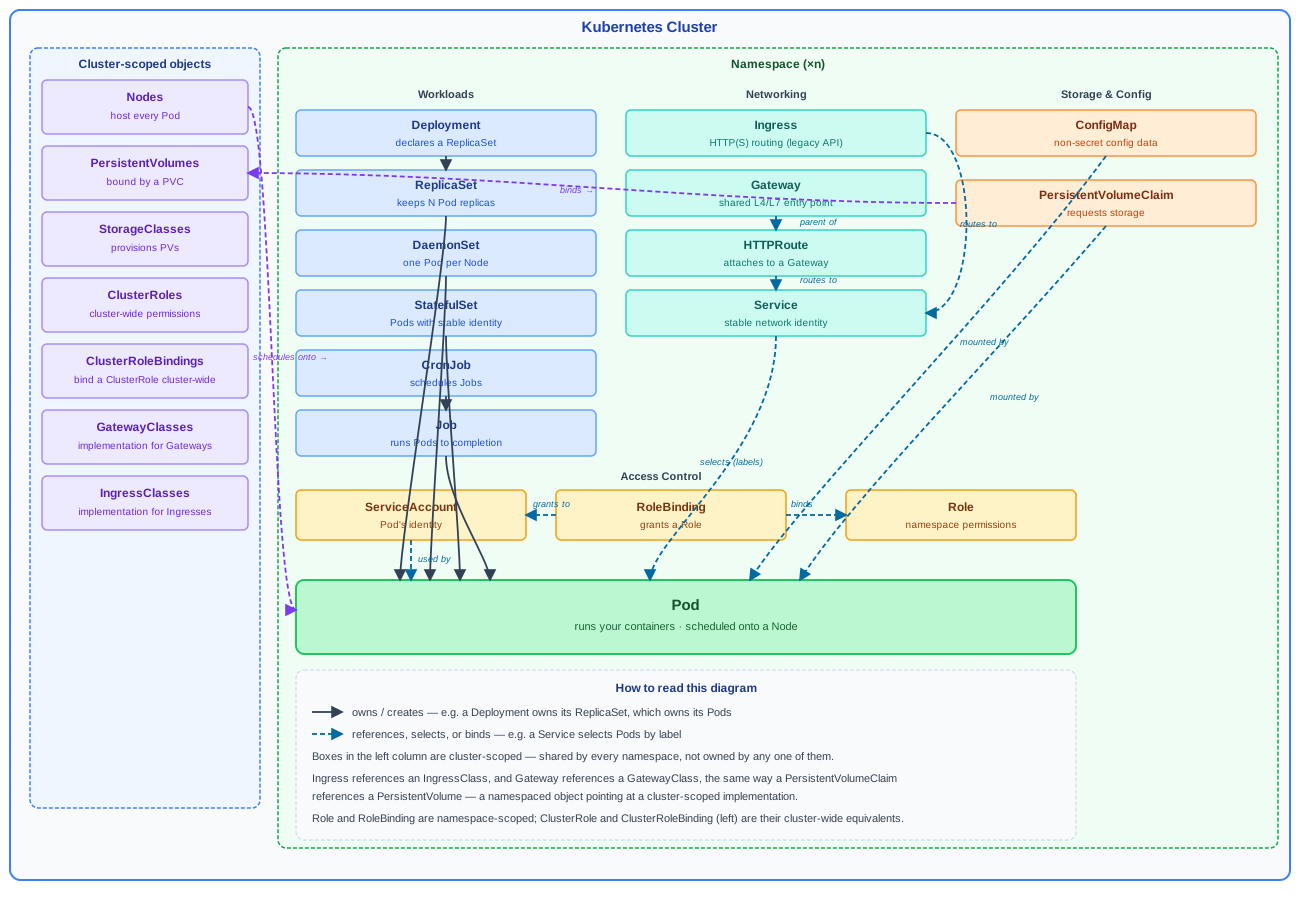
Two patterns repeat across the diagram, and knowing them is enough to reason about any kind not pictured:
-
Ownership (solid arrows) — a controller creates and manages the objects below it, and deleting the controller deletes what it owns. Deployment → ReplicaSet → Pod is the clearest example; DaemonSet, StatefulSet, and CronJob → Job all end the same way, at a Pod.
-
Reference (dashed arrows) — one object points at another without owning it. A Service selects Pods by label rather than owning them; a PersistentVolumeClaim binds to a PersistentVolume; a RoleBinding grants a Role’s permissions to a ServiceAccount. The referenced object can outlive the object referencing it.
Everything in the left-hand Cluster-scoped objects column is shared by every namespace rather than belonging to one — this is why Nodes, PersistentVolumes, StorageClasses, ClusterRoles, ClusterRoleBindings, GatewayClasses, and IngressClasses all sit outside the Namespace boundary in the diagram, and why Clusters and Nodes get their own ungrouped entries at the top of the sidebar rather than living inside a namespace-scoped category.
Search bar
The search bar above every table accepts field=value filters directly — for example, kube_cluster_name=prod or kube_namespace=default. Combine multiple fields to narrow further; auto-suggestions list matching field names and, once you pick one, the current values available for it. Typing here and checking a tag or label in the sidebar panel stay in sync: a value you check appears in the search bar, and a term you type is reflected as a checked value in the panel.
Tags and labels panel: narrowing within a resource kind
Below the resource-kind picker, a second panel narrows the currently selected kind’s table down to a subset by tags and Kubernetes labels Kloudfuse attaches to an object and the labels already on it. The panel always starts with a Cluster group (a checkbox per monitored cluster, with a live object count), followed by a search box and a dynamically generated set of tag and label groups built from whatever labels and annotations are actually present on the objects of the selected kind (for example k8s_app, kube_app_component, chart, component, control_plane, and any custom labels your manifests set). Because this list is generated from your cluster’s own labels, it differs by resource kind and by environment.
Use the search box at the top of the panel to jump straight to a tag or label by name instead of scrolling, and expand a group to see its possible values and how many objects match each one.
Group and sort
Use the group/ungroup icon in a column header to group the table’s rows by that column — for example, group Pods by Namespace, or Nodes by Status — to see how objects are distributed before drilling into individual rows.
Click a column header to sort by it, and again to toggle ascending/descending. Use sorting to find the highest resource usage, the longest-running pods, or the newest deployments at a glance.
The resource detail pane
Click any row, in any resource kind’s table, and the same detail-pane layout opens: a slide-over panel with up to five tabs. What’s inside each tab is not identical, though — it’s specific to the kind you clicked. This consistency of layout, paired with kind-specific content, is intentional — once you know where to look for a Pod’s status, you know where to look for a Service’s Cluster IP or a Node’s capacity, even though the values themselves are different.
- Details
-
A key-value summary specific to the kind — a Pod shows cluster, node, namespace, IP, status, QoS, age, restarts, and ready count; a Service shows type, cluster IP, external IP, and ports; a Node shows status, schedulable, roles, and capacity; and so on — followed by Labels and Tags sections pulled from the object’s Kubernetes metadata. A search box at the top filters long detail lists.
- YAML
-
The object’s live configuration, as last observed by Kloudfuse. Toggle between Structured (a collapsible tree, the default) and Raw (plain YAML text) views. Clusters don’t have a YAML tab — a cluster isn’t represented by a single Kubernetes manifest the way a Pod or Deployment is.
- Metrics
-
A grid of time-series charts scoped to the object, chosen for what that kind actually is. A Pod shows CPU and memory requests/limits/usage plus network rate/errors for itself. A Service has no compute of its own, so its Metrics tab instead aggregates CPU and memory requests/limits/usage by the Pods it fronts, alongside network rate and errors. A Node shows its own capacity and allocation. Each chart can be expanded to full size.
- Logs
-
Log lines correlated to the object by its identifying labels (cluster, namespace, pod, container), with the same column and search controls as the standalone Logs Explorer.
- Events
-
Kubernetes events for the object — scheduling decisions, restarts, warnings, failed operations — in the same table layout as Logs.
Because every tab is scoped to the object you clicked and the time range in the top-right corner, you can move from "this object’s config" to "its resource usage" to "its logs at the moment something went wrong" without leaving the pane or re-entering filters.