Trace Cost & Usage
Trace Cost & Usage shows what your instrumented agents spent, calculated from the spans they send to Kloudfuse. Because the figures come from your spans, you can attribute spend to a service, agent, or custom label. To open it, select Agents > Cost & Usage > Traces.
For the amounts your provider accounts report, see Provider Cost & Usage.
Panels
Use the filters and the time range to scope every panel on the page.
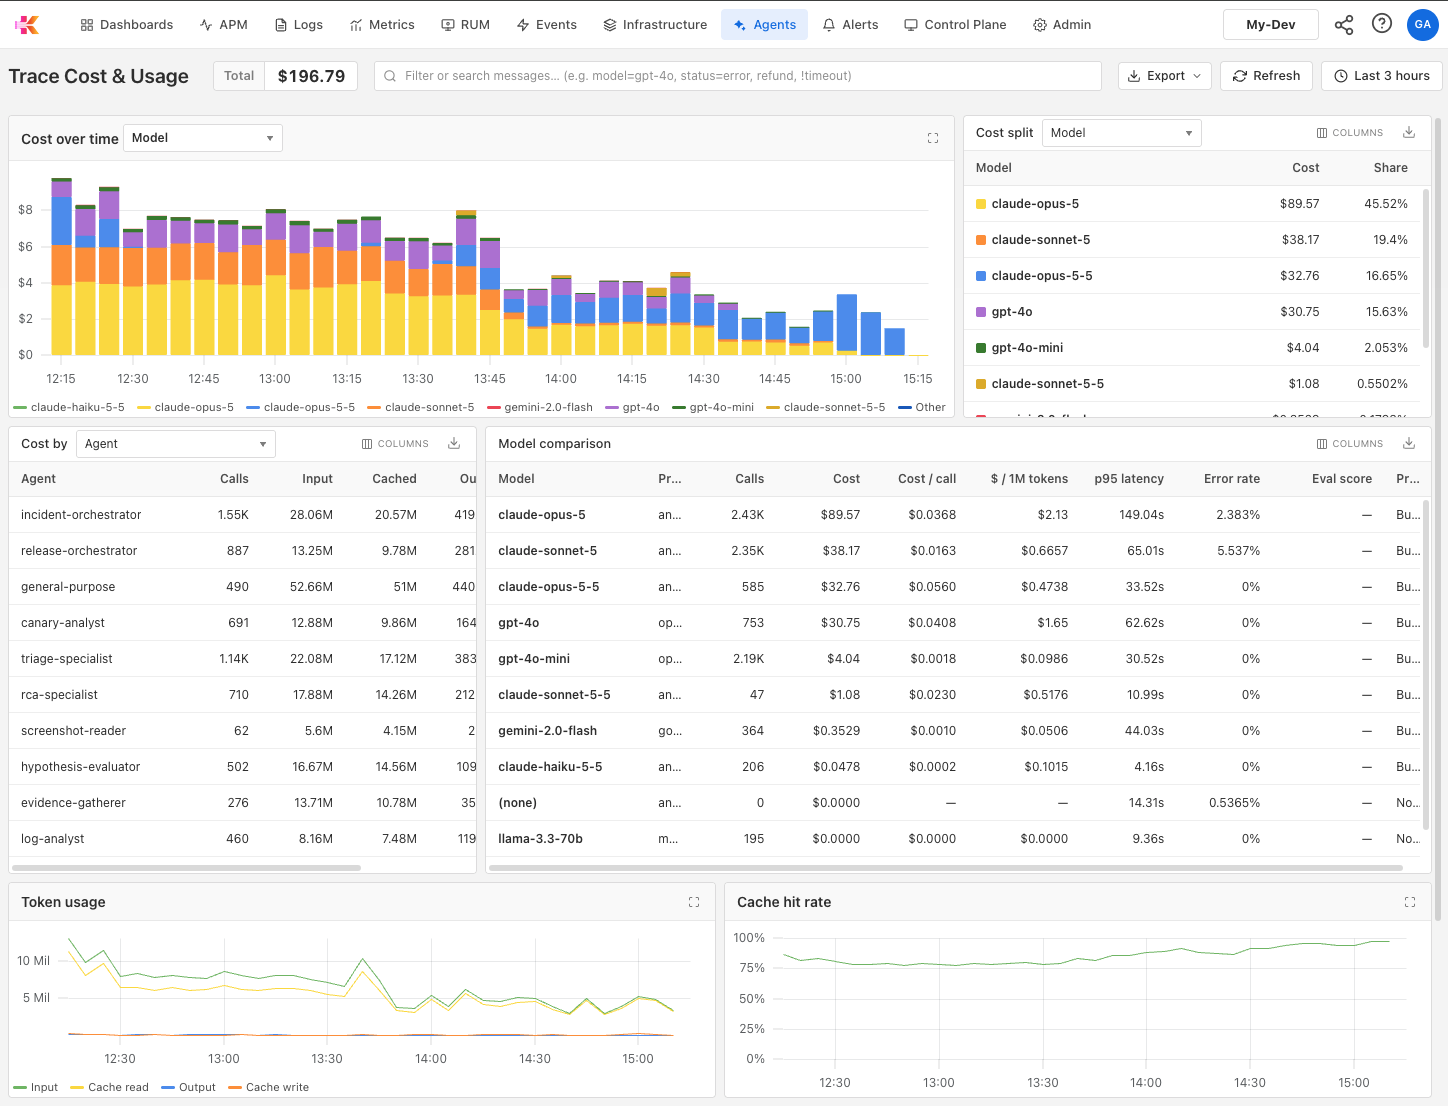
- Total
-
Total cost in the selected window.
- Cost over time
-
Cost as a trend, grouped by Model, Service, Agent, or Cost source.
- Cost split
-
A table of each group’s cost and share, by Model, Service, Agent, or Provider, or a view of your Spend pace.
- Cost by
-
A table of cost, calls, and tokens, grouped by Service, Agent, or any label on your spans. Use it for your own dimensions, such as a team or customer label.
- Model comparison
-
Each model’s calls, cost, cost per call, cost per million tokens, p95 latency, and error rate, along with what priced it.
- Token usage
-
Input, output, cache read, and cache write tokens over time.
- Cache hit rate
-
The share of input tokens read from cache over time.
- Spend on failed calls
-
What failed calls cost over time.
How cost is calculated
Kloudfuse sets a span’s cost when it is ingested, using the first of these that applies. The Priced by column and the Cost source grouping show which one was used:
| Order | Source | Meaning |
|---|---|---|
1 |
|
The span reported its own cost, which applies to LiteLLM and OpenRouter spans. |
2 |
Your price table |
A price an administrator edited or added in the model price table. |
3 |
Built-in prices |
The default price included with Kloudfuse, calculated from the span’s model and token counts. |
- |
Not priced at ingest |
None of these applied, so the span has no cost. |
To edit or add a price, see Model Prices. Kloudfuse stores each span’s cost at ingest, so a price change does not affect existing spans.