Agent Telemetry
The telemetry views show every span your agents send to Kloudfuse, from a summary of all activity down to a single model or tool call. Use them to read what an agent did and find out why a run failed or cost more than expected. They are under Agents > Telemetry.
Concepts
- Span
-
One operation, such as a model call, a tool call, or an agent invocation.
- Trace
-
All the spans from one run of your agent.
- Session
-
All the traces from one conversation, grouped by the conversation ID on your spans. Spans without a conversation ID belong to no session.
Overview
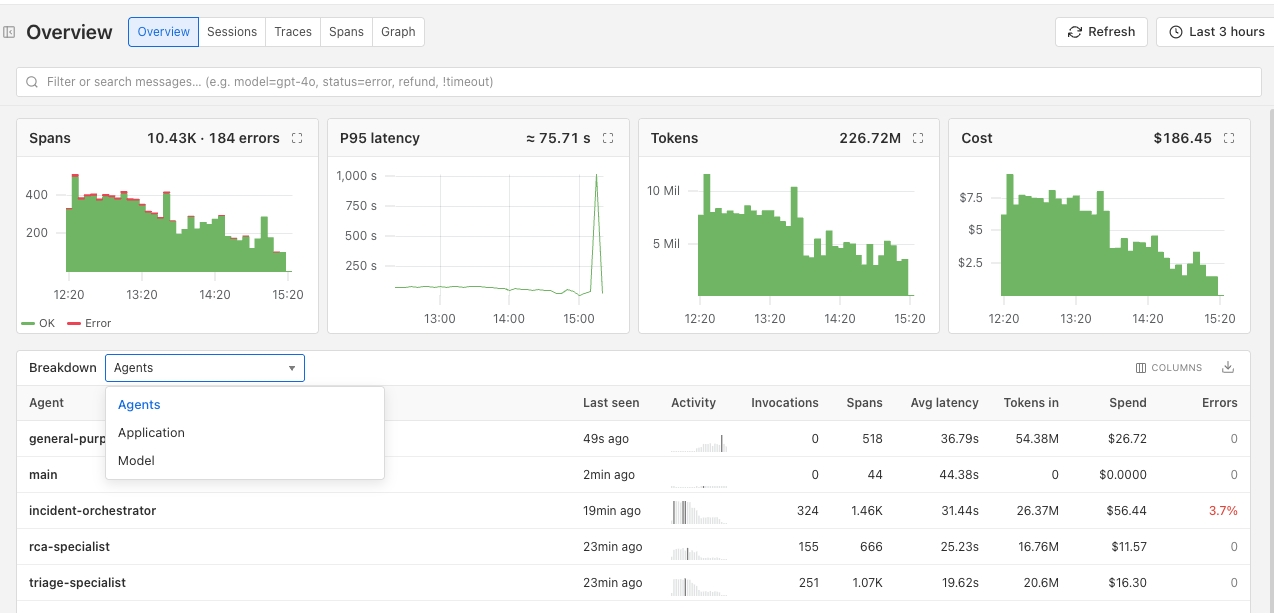
Overview summarizes the selected time range. It charts spans, p95 latency, tokens, and cost over time, and includes a breakdown of activity and spend by dimensions such as agent, application, and model.
Sessions
Sessions lists conversations, with the first input, last output, trace and span counts, tokens, cost, errors, and duration. Select a session to open its details:
-
Transcript shows the whole conversation. See Transcript.
-
Traces lists the session’s traces. Use Errors only to keep just the failed ones.
-
Costs breaks down the session’s spend.
-
Graph shows the agent graph for this session.
Use Compare with… to compare a session with others.
Traces
Traces lists individual runs, with the root span name, session, input, output, span count, tokens, cost, errors, and start time. Select a trace to open its details:
-
Transcript shows the conversation for this run.
-
Spans shows each span in a waterfall. See Span details.
-
Scores shows evaluation results for this trace, if any.
-
Costs breaks down the trace’s spend.
Use Compare with… to compare a trace with others.
Spans
Spans lists every span, with its name, kind, model, input, output, tokens, cost, duration, and status. Use this view to search across runs, such as all calls to one model or all failures of one tool. Select a span to open its details.
Transcript
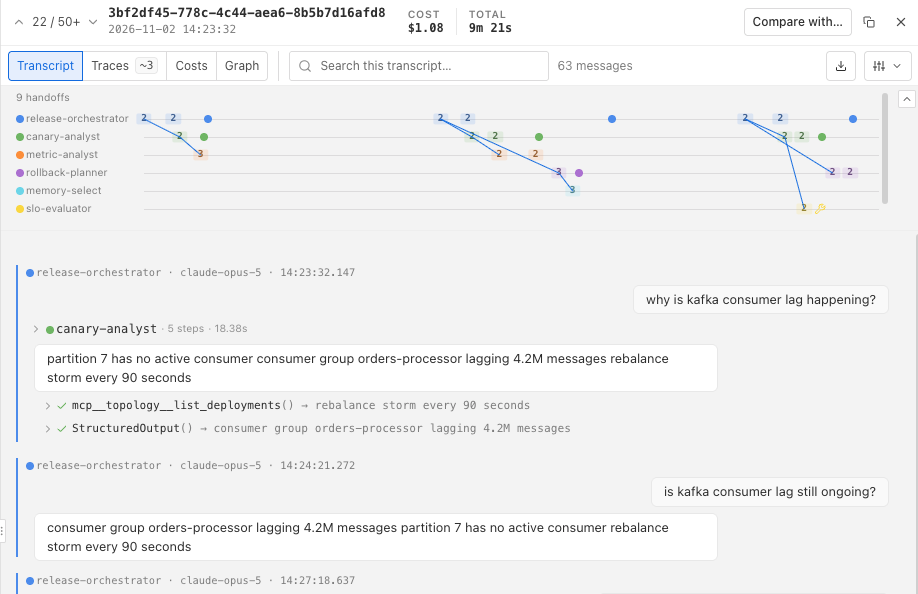
The transcript shows a run as a conversation instead of a span tree: user messages, model responses, and tool calls and results, in order. When more than one agent is involved, a strip above the conversation shows the handoffs between them. It requires message content on your spans, which many instrumentation libraries do not capture by default.
Span details
Selecting a span opens a panel with these tabs:
- Span Attributes
-
Every attribute on the span.
- Gen AI
-
The call itself: operation, provider, model, request settings, system instructions, input and output messages, the tools offered to the model, token usage, cost, and duration.
- Errors
-
Whether the span failed and why, including the error type, status description, and any exceptions. A count on the tab shows when there are errors.
- Scores
-
Evaluation results for this span, if any.
Filter the views
All of these views share a filter panel and time range. Filter on any label on your spans, or from values in the tables and span details. If the query hits a limit, a banner warns that results are partial and that cost figures are lower bounds. To see full results, narrow the time range or add a filter.