Agent Graph
The Agent Graph shows how your agents connect: which agents call which other agents, and which tools each one uses. Use it to see how spans flow from agent to agent and to confirm that your requests take the correct path. Kloudfuse builds it from the parent-child relationships between your spans, across all traces in the selected time range. To open it, select Agents > Telemetry > Agent Graph. The same graph, scoped to one conversation, is on the Graph tab of a session.
Read the graph
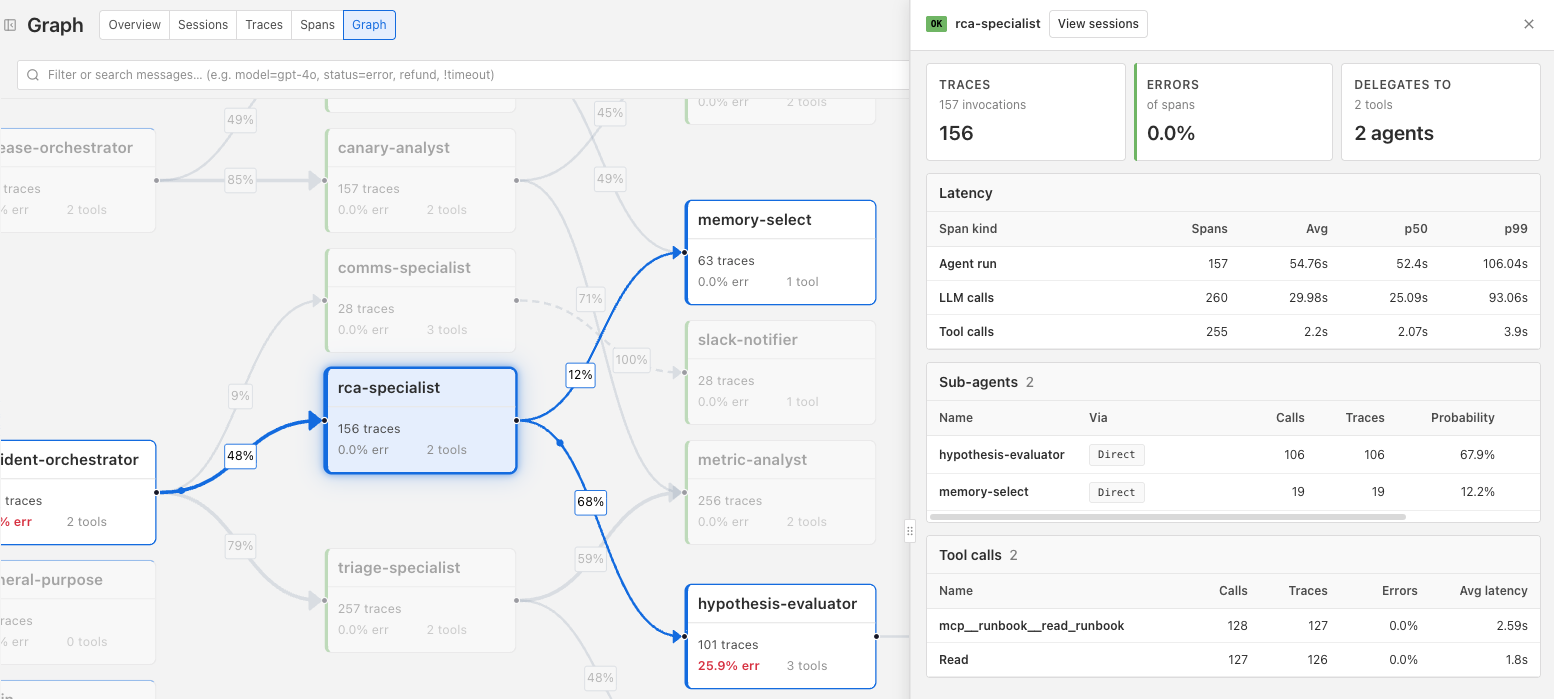
- Nodes
-
Each node is an agent, with its trace count, error rate, and number of tools. Every agent named in the window appears, even if it never calls another agent.
- Edges
-
An edge from one agent to another means that the first agent called the second, and its percentage shows the probability of that call. Kloudfuse finds the edge by following each agent invocation’s parent spans up to the nearest span from a different agent.
Select an agent to highlight its connections and open its details: traces and invocations, error rate, latency by span kind, its sub-agents, and its tool calls. Select View sessions to see its sessions.
Edge probability
The percentage on an edge is the share of the parent agent’s traces in which it called that child agent. For example, an agent that appears in 100 traces and calls a child in 68 of them shows 68% on that edge. Traces in which the parent called no other agent still count, so an agent that rarely calls others shows low percentages.
Each edge is calculated on its own, so the percentages leaving an agent can add up to more than 100%. A trace in which the parent called two children counts once toward each edge. For example, if an agent appears in 100 traces, calls one child in 80 of them, and calls another child in 60, its edges show 80% and 60%, for a total of 140%. No single edge goes above 100%.