Metrics Architecture
Kloudfuse’s metrics screens are four different views over one time-series store, all built on the same PromQL query model. This page explains how a sample gets into that store, what a query looks like structurally, and how the four screens — Explorer, Cardinality, Derived Metrics, and Metric Usage — fit together.
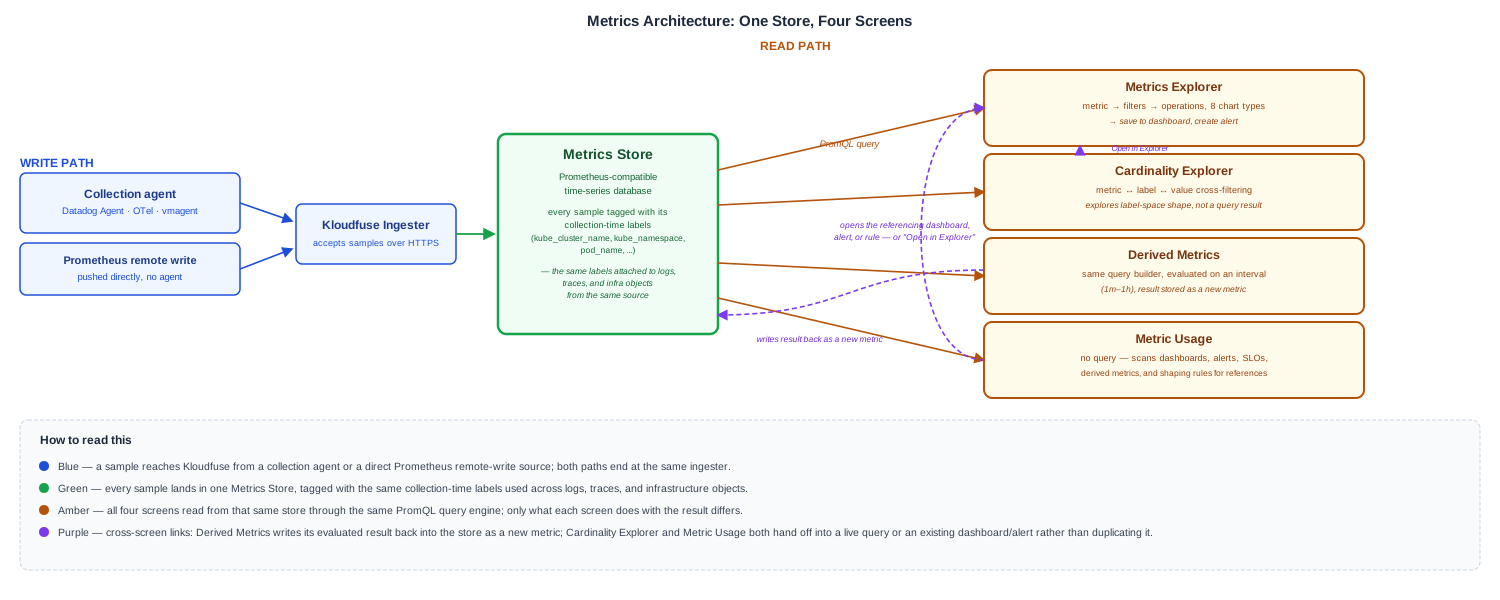
How a sample reaches the Metrics Store
A metric sample reaches Kloudfuse one of two ways: a collection agent (the Datadog Agent, the OTel Collector, or a metrics-only agent like Prometheus or vmagent) scrapes or receives it and forwards it to the Kloudfuse ingester, or a Prometheus-compatible system pushes it directly via remote write. Either path ends at the same place — the ingester writes the sample to the Metrics Store, tagged with whatever labels the source attached (kube_cluster_name, kube_namespace, pod_name, and so on, for Kubernetes sources).
Which agent to run, and exactly what it collects, is its own topic — see Integration Overview for choosing an integration and Kubernetes Integration Architecture for the Kubernetes agent-by-agent breakdown. This page picks up once a sample has landed in the Metrics Store and become queryable.
One query model, four screens
Every screen described below ultimately runs a PromQL query — a metric name, an optional set of label matchers, and an optional aggregation or function — against the Metrics Store. Nothing about the query language changes from screen to screen; what changes is what each screen does with the result:
- Metrics Explorer
-
Build a query, visualize it as any of eight chart types, and act on it — save it to a dashboard or turn it into an alert.
- Cardinality Explorer
-
Don’t run a query against data — explore the shape of the label space itself: which metrics exist, which labels each one carries, and how many distinct values each label has, to find what’s driving series count before you write a query.
- Derived Metrics
-
Take a query that’s expensive or common enough to be worth caching, evaluate it on a fixed interval, and write the result back into the Metrics Store as a brand-new metric — the only one of the four that writes as well as reads.
- Metric Usage
-
Don’t query the Metrics Store at all — scan your dashboards, alerts, SLOs, derived metrics, and shaping rules for which metrics and labels they reference, so you know what’s safe to drop.
Because they share the same query engine, the screens link into each other rather than duplicating functionality: a metric or label value in Cardinality Explorer has an Open in Metrics Explorer action that hands off the same selection as a live query; a reference in Metric Usage opens the dashboard, alert, or derived metric that made it.
Anatomy of a query: the Explorer’s query builder
The query builder in the Explorer — and, unchanged, in Derived Metrics' query step — has three parts, filled in left to right:
- Metric
-
A searchable dropdown of every metric name in the Metrics Store.
- Filters
-
Zero or more
label operator valueconditions (=,!=,=~,!~), with an AND operation. Both the label and the value fields autocomplete from what’s actually present on the selected metric. - Operations
-
An aggregation (
sum,avg,min,max,count, and others) or a function from the range, rollup, histogram, trigonometric, time, or binary-operation categories, optionally groupedbyone or more labels.
This structured form and its raw-PromQL equivalent are two views of the same query — see Builder vs. Code — and the full function and operator reference lives in PromQL, not duplicated here.
Labels are what tie a metric back to everything else
A metric carries the same identifying labels — kube_cluster_name, kube_namespace, pod_name, node_name, and so on — as the logs, traces, and infrastructure objects collected from the same source. This is what lets Infrastructure's per-object Metrics tab show charts scoped to one Pod or Node without a separate query language, and what makes by (kube_namespace) in the Explorer answer the same question as filtering the Infrastructure Explorer to one namespace: both are grouping by a label that means the same thing everywhere it appears.
Next steps
-
Metrics Explorer — the query builder, chart types, filters, formulas, and alerting in detail
-
Metric Types — counters, gauges, and histograms, and what each one lets you compute
-
Metrics Cardinality Explorer, Derived Metrics, and Metrics Usage — the other three screens
-
Metrics User Guide — putting this all together to diagnose a specific problem