Exploring through log analytics
Add log filters
Add any log filters as described in the Log Search View to filter down logs for charting
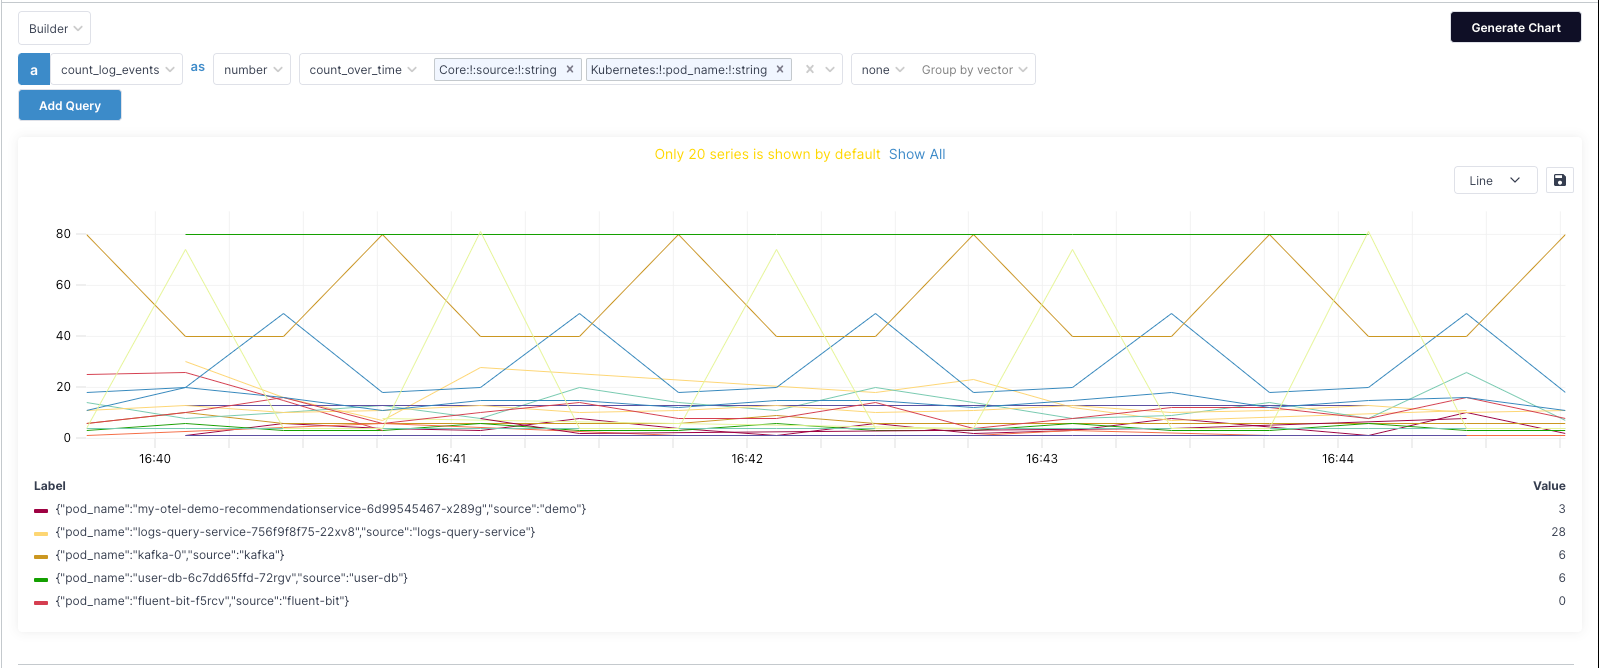
Explore count-based log metrics
-
Choose
count_log_eventsfromthe log facet selector. -
Choose number as the normalization function.
-
Choose
rateorcount_over_timeas the Range/time aggregation function. -
Click Generate chart to chart the count-based metric.

Explore facet log metrics
-
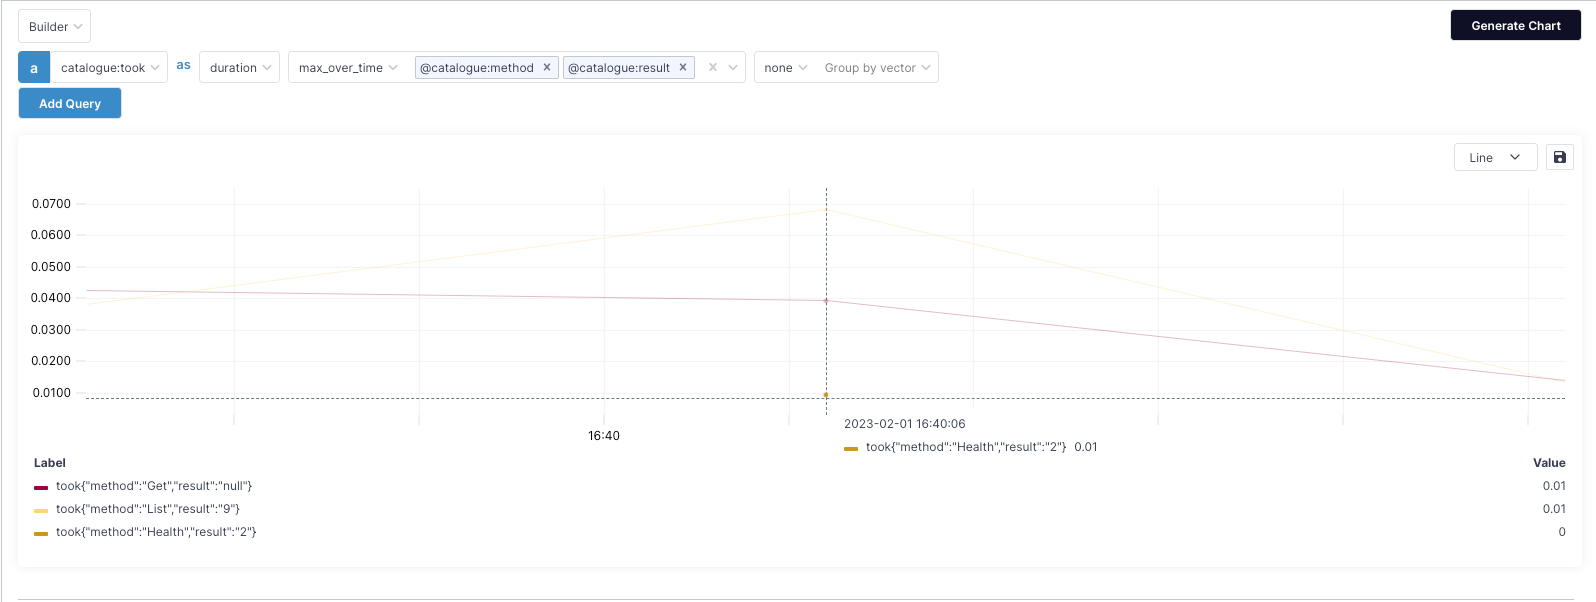
Choose the log facet from the log facet selector.
-
Choose one of
number,bytes, ordurationas the function to normalize the facet value. -
Choose
countto count the number of times the log facet appears in thetime-step. -
Choose one of the log facet-based range aggregation functions.
-
Click Generate chart.

